

![]() Canadian Pacific Kansas City Limited is one of six class 1 railroads in North America, and is essentially one half of a duopoly (with Canadian National Railway) with two railroads serving the eastern United States, two railroads serving the western United States, and two railroads serving Canada by extending coast-to-coast and then down in a T-shape through the middle of the United States down to the Gulf of Mexico and, in the case of Canadian Pacific Kansas City Limited, down into Mexico as well.
Canadian Pacific Kansas City Limited is one of six class 1 railroads in North America, and is essentially one half of a duopoly (with Canadian National Railway) with two railroads serving the eastern United States, two railroads serving the western United States, and two railroads serving Canada by extending coast-to-coast and then down in a T-shape through the middle of the United States down to the Gulf of Mexico and, in the case of Canadian Pacific Kansas City Limited, down into Mexico as well.
Canadian Pacific Kansas City Limited benefits from physical network effects because of its virtually unrivaled 20,000-mile rail network connecting Canada, the United States, and Mexico.1
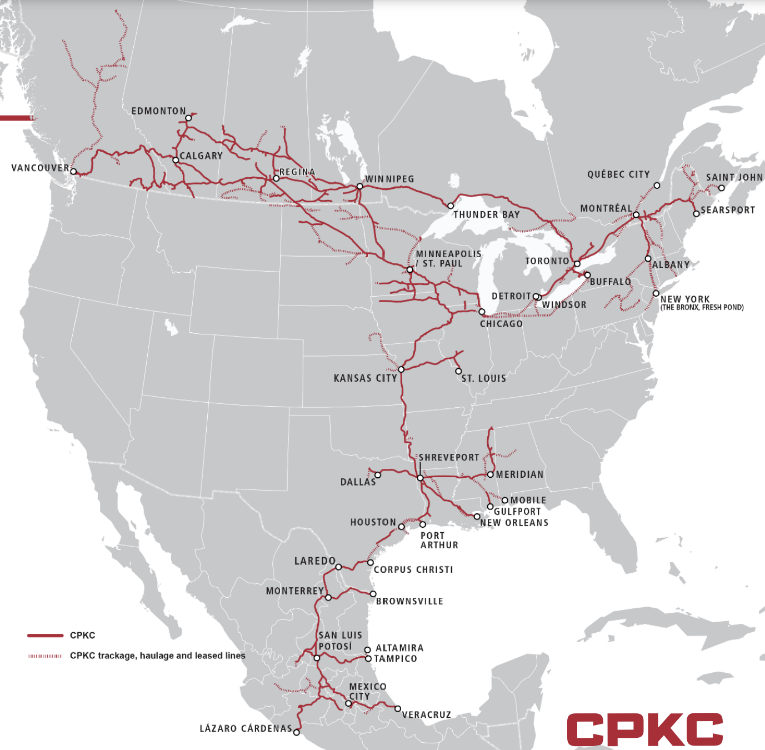
Source: Slide 5 of Q1 2023 Earnings Review.
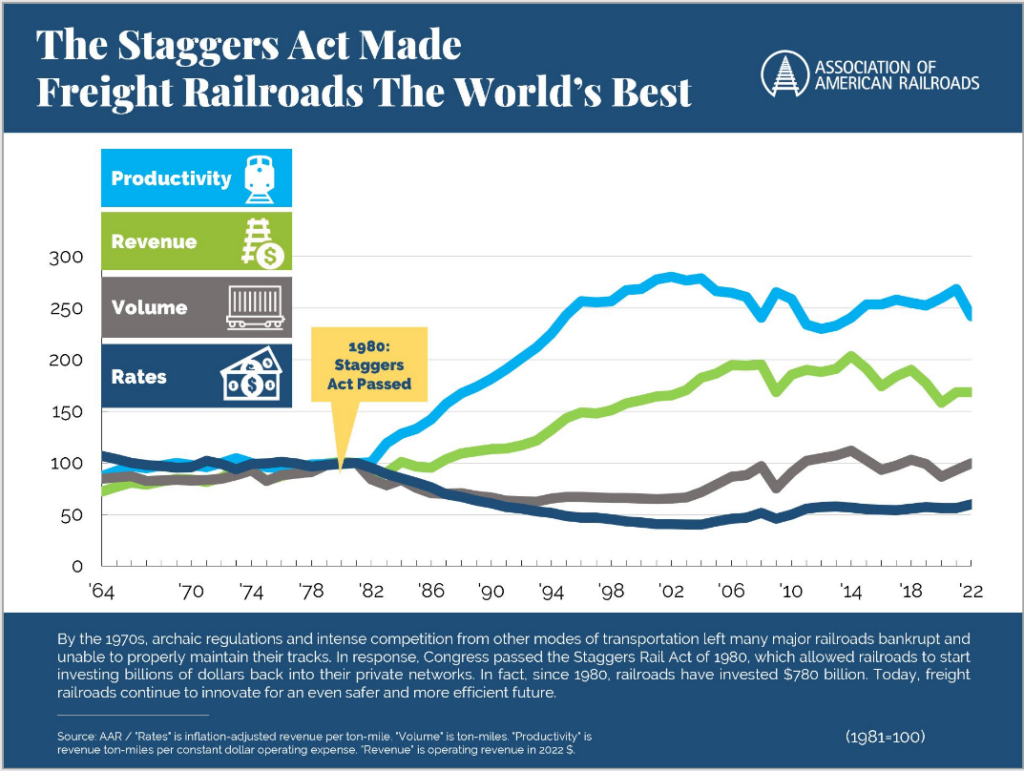
Railroads also benefit from a not-in-my-backyard (“NIMBY”) dynamic that makes it almost impossible to construct a new, competing railroad. In fact, because of NIMBY, transportation deregulation that accelerated following the Stagger’s Act of 1980, and industry consolidation, the number of North American railroad miles has fallen from a peak of 250,000 in the early 1900s to less than 100,000 today and the number of North American class 1 railroads has plummeted from over 180 to just 6 today.2
![]()
Source: Rodrigue, J-P (ed) (2020), The Geography of Transport Systems, Fifth Edition, New York: Routledge.
When combined with steadily rising freight demand, this supply-side rationalization has dramatically changed the pricing dynamic in the railroad industry. In the early 2000s, long-term, inflation-adjusted pricing trends inflected from consistent declines to a now almost 20-year period of consistent increases.3
And given the continued projected growth in freight demand,4 the now oligopolistic structure of the railroad industry, and the much lower pricing railroads can profitably offer (see first chart5 below) as a result of their massive energy and labor efficiency relative to trucking, making them especially dominant on long-haul routes (see second chart6 below), we believe the six North American class 1 railroads will continue to grow their pricing, revenue, and profits faster than inflation for years to come.

Source: Bureau of Transportation Statistics.
![]()
While we believe all the North American class 1 railroads are attractive long-term investments, we’ve chosen to invest in the Canadian rails because we believe they can grow faster and have less regulatory risk than the U.S. rails. We believe they can grow faster than U.S. rails because their volume growth benefits from less exposure to secularly declining coal as well as a long-term trend of Canadian ports taking share from U.S. ports because of greater government investment.7 Furthermore, we believe they have less regulatory risk than U.S. rails because Canadians have historically been more comfortable than Americans with oligopolistic industry structures, as can be seen most clearly by differences in their banking system approval ratings. Canadians overwhelming approve of their oligopolistic banking system,8 in which the top five banks have over 85% market share,9 whereas Americans distrust their banking system and, in particular, the big banks,10 despite the fact that the top five banks in the United States have only 25% market share.11
In summary, we think the Canadian rails are dominant networks with enduring pricing power that essentially serve as toll collectors on both North American and global industrial production, thereby making them a great way to participate in the long-term growth of these important categories.
Back to Global Champions Summary Page
1 See https://investor.cpkcr.com/news/press-release-details/2023/CPKC-adds-1000-reefers-to-expanding-MMX-service/default.aspx.
2 See https://transportgeography.org/contents/chapter5/rail-transportation-pipelines/rail-track-mileage-united-states/.
3 See https://www.aar.org/issue/staggers-act/.
4 See https://www.bts.gov/newsroom/freight-activity-us-expected-grow-fifty-percent-2050.
5 See https://www.bts.gov/content/average-freight-revenue-ton-mile.
6 See https://data.bts.gov/stories/s/Moving-Goods-in-the-United-States/bcyt-rqmu.
7 See https://www.porttechnology.org/news/study-finds-canadian-ports-receive-double-the-amount-of-funding-than-west-coast-ports/#:~:text=A%20study%20commissioned%20by%20ports%20in%20Washington%20and,of%20federal%20funding%20than%20US%20West%20Coast%20ports.
8 See https://reviewlution.ca/resources/canadian-banking-statistics/#:~:text=As%20of%20December%202020%2C%20the%20big%20five,banks%20in%20Canada%20market%20share%20is%20over%2085%25.
9 See https://reviewlution.ca/resources/canadian-banking-statistics/#:~:text=As%20of%20December%202020%2C%20the%20big%20five,banks%20in%20Canada%20market%20share%20is%20over%2085%25.
10 See https://fivethirtyeight.com/features/its-not-just-silicon-valley-bank-americans-havent-trusted-banks-for-years/#:~:text=But%20Americans%20haven%E2%80%99t%20had%20much%20confidence%20in%20banks,%E2%80%94%20including%20banks%20%E2%80%94%20since%20before%20the%201980s.
11 See https://www.statista.com/statistics/727548/market-share-top-banks-thrifts-usa-by-assets/.