

“If Ye Are Prepared, Ye Shall Not Fear”1
While enjoyable, I hesitate to speak about the macro economy because regardless of the overall market values, in the end, it comes down to owning solid, individual businesses at the right price. However, In light of the fact that this is our very first client letter, I thought I’d take a little more time and explain some current thoughts on the general market. It is our hope that you will take comfort in knowing YCG is taking into account the complex and challenging issues facing our economy today. Despite an overall bearish analysis, we are encouraged by the unique buying opportunities that avail themselves only during such conditions. As Henry Hartman once said, “Success comes when opportunity meets preparation.” We agree that success depends upon preparation, and thus have spent much of the last quarter preparing your portfolio to not only weather the current storms, but to thrive during them.
On April 1st, the S&P 500 jumped 3.6% – April Fools! Ironic, isn’t it? About a year ago, on July 14, 2007, I met with several intelligent friends from the financial industry to discuss the formation of Yacktman Capital Group. I told them I felt we were at or near the top of the market, and that either before the end of this year, and certainly entering 2008, I felt the markets were going to really be in for it. On that day, the S&P 500 index was trading at $1,552.50. Today, it trades at $1,280.00, a 17.6% decline.
The last 12 months have proven to be a time of uneasiness in the markets, as I’m sure you are aware from listening to the media and watching the volatility in your portfolio values. This last quarter was no exception, with the markets getting clobbered, particularly in the financial sector. Perhaps there are some topics that are unsettling to you, and I’d like to discuss a few of them. While these topics are all inter-related, I will try to separate them out somewhat.
Bubbles Everywhere
I believe we are involved in the most serious financial crisis of our lifetime. How did we get here?
Let me take you back to March of 2000 when the tech bubble officially burst (although, technically, with dividends reinvested, the true peak was in September of that year). The Fed responded by slashing interest rates. They poured another significant amount of money into the system after 9-11 as well. While these moves helped prop up the economy, there was such an influx of liquidity sloshing around that it led to other bubbles.
Short-term interest rates actually dropped below zero in real terms, and this led to poor decisions as investors sought places for this “free money.” As more and more cash piled into the economy, all asset classes seemed to be over-valued, creating smaller expected future returns. This was a dangerous combination – investors (and speculators) with “free money” in their pockets seeking to squeeze out extra returns from over-valued assets – essentially, they assumed greater risks for smaller returns.
Housing Bubble
One bubble in particular surfaced…the housing bubble. This easy money came in the form of lower mortgage rates. Homeowners eagerly sought to get larger homes for the same monthly payment. In addition, under the assumption that home prices always appreciate, home “flippers” only exacerbated the problem. As demand increased, home prices began to move higher and higher and affordability became a problem. To put this in perspective, from 1975 to 2000, home prices grew at a real rate of approximately 1-1.5% annually. From 2000 to present, they grew nearly 8% annually (doubling in price) to unsustainable price levels – the first housing bubble on a national scale. Home prices need to drop more than a third to return to the typical trend line!
During this period of rapid price expansion, financial “innovation” (interesting use of the word) stepped in with exotic sub-prime products from adjustable-rate mortgages to teaser interest-only loans, and even negative-amortization loans. In addition, there came a decline in lending standards from complacent lenders eager to increase the bottom line. Even the most basic principles of sound lending such as requiring documentation of income and assets were overlooked, and consumers with weak credit ratings miraculously qualified. Mortgages were sloppily created at a whim, packaged up and securitized, and sold off to investors. Credit rating agencies weren’t much help, either. Somehow, after pooling together several poor mortgage loans that never should have been made, the rating agencies remarkably put their blessing on these securitized loans as investment-grade gold – and may I add, accepted a nice fee along the way.
Eventually, it became apparent these loans were toxic, and unfortunately, there was a tremendous amount of leverage to purchase these loans. Now, nobody knows what they’re worth, and they became very illiquid securities. I find it ironic that the investors who purchased these lousy securitized loans often borrowed money from the same banks that created and sold off the loans in the first place! We are now witnessing this self-destruction as the markets clear and write-offs come piling in. To date, banks have taken approximately $150 billion of write-downs related to subprime. Some investment banks estimate total subprime losses will amount to anywhere from $300 billion to $600 billion. The asset size of the subprime securities market is approximately $1.2 trillion. Fortunately, even if half of the assets really did go bad, much of that money would still be recovered because homes are being used as collateral. Additionally, while these numbers sound large, they make up a very small part of the nearly $50 trillion of debt outstanding in U.S. markets. However, these numbers do not include the additional losses that are yet to come from off-balance sheet losses as a result of recourse exposure. This is where the issuer is possibly under contractual obligation to repurchase defective loans. These losses could amount to hundreds of billions, as well. Furthermore, there are hundreds of millions of dollars outstanding in home-equity loans that eventually could be worth zero. The point is, the mortgage industry is deleveraging and as markets clear, things are going to be painful.
Credit Crisis and the Fed’s Response
With the housing bust, along came the current credit crisis. As losses mount, capital ratios suffer and lending capacity shrinks. Banks are finding it difficult to support present debt levels, let alone feed the economy with new credit. A lack of liquidity is what is believed to have caused the Great Depression. Well, the Fed’s number one priority is to protect the banking system, and through all this, they obviously didn’t stand by and watch with no action on their part.
In an emergency move during mid-March, the Fed responded by slashing interest rates over the weekend to save the financial industry. Then, they stepped in to prevent what could have been a major financial meltdown by facilitating a purchase of collapsing Bear Sterns into the hands of JPMorgan Chase, with the government assuming nearly all the risk. And the rescuing hasn’t ended there. The Fed stepped in to save Indymac Bank, and has sent out a lifeline to Freddie Mac and Fannie Mae. Nobody knows how many more bailouts there will be, or how much they will cost. It’s a shame that the irresponsible, loose lending on the part of employees at financial institutions is now requiring American taxpayers to pay the price for their carelessness. Taxpayers have already spent billions in rescuing Bear Stearns and Indymac Bank, and should the Fed need to implement a rescue plan for Freddie and Fannie, it will amount to many billions more. Ironic that these two major entities created to bring liquidity to the housing market may actually be in need of help with their inability to bring that liquidity.
To help illustrate how serious things are, consider the Fed’s other initiatives. When receiving my undergraduate degree in Economics, I learned that the Federal Reserve has three main tools to help regulate the money supply – changing the discount rate, changing reserve requirements (the amount of funds commercial banks must maintain at the Federal Reserve Bank), and open market operations (the buying and selling of U.S. Treasuries in the open market). Well, in March, the Fed began allowing brokerage firms to borrow from its discount window for the first time since the 1930s. Additionally, out of desperation, the Fed created several more options. In December, they created the Term Auction Facility (TAF) and in March they created the Term Securities Lending Facility (TSLF) and Primary Dealer Credit Facility (PDCF). These three initiatives were all created to essentially give commercial and investment banks access to capital, either by loaning money directly or the ability to quickly and easily raise capital by exchanging their risky mortgage-backed securities that have uncertain value for U.S. Treasuries and using those as collateral instead.
While I’m not being critical of the Fed’s actions, we need to realize that the Fed’s rescue operations of these institutions also leads to unintended consequences. Every new solution seems to create a new problem, or as the saying goes, in filling up one hole, you dig another. For example, there is the concern of moral hazard risk, that is, the unintended consequences that will take place in the future if people believe the government will always be there to bail out reckless, irresponsible risk-takers. There is also the concern the federal government will desire to completely overhaul the regulation of the financial industry. I hope they will stick to the basics: The Fed’s responsibility is to protect the banking industry, and the SEC’s responsibility is to prevent securities fraud. But now, financial institutions will likely lose the “hands off” privileges as federal oversight expands. Isn’t it odd, that when things are going well, nobody complains; or if they do, the complaint is about being over-regulated? Then, when a crisis surfaces, regulators are blamed and there is a cry for more stringent regulation. If history has taught us anything (even as recent as Sarbanes-Oxley), it’s that these initiatives tend to do more harm than good.
The biggest concern stemming from the Fed’s actions is inflation. There’s no doubt that the Fed’s decisions have largely been responsible for the significant increase in inflation as of recent. The classic recipe for inflation is “too much money chasing too few goods.” As already explained, to help us through this credit crisis, the Fed has used several tools to flood the economy with liquidity (too much money), and this is in the midst of an economic slowdown (too few goods). As one would expect, when the Fed began lowering short-term interest rates and increasing the money supply last September, this coincided with the significant decline in the exchange value of the U.S. dollar, or in other words, more inflation. Thus, Americans are not only paying for the bailouts directly, but indirectly, they are contributing even more on a cumulative basis in the form of higher prices.
Furthermore, as discussed above, the government continues to bring on additional debt as it strives to rescue the financial sector. With the U.S. economy running the largest account deficit in history, this adds substantial risk of further weakness in the U.S. dollar. And as the value of the dollar deteriorates, inflationary pressures elevate, especially in a recessionary environment.
In a worst case scenario, as the deficit continues to increase, foreigners may become suspicious in the value of the dollar and the creditworthiness of the U.S., and it’s quite possible the dollar could lose its status as the world’s reserve currency. Countries around the globe could begin to de-peg their currencies to the dollar because a falling dollar adds inflationary pressures in their own country. This could obviously lead to enormous negative repercussions in the U.S. – interest rates would need to rise sharply to persuade foreigners to continue holding U.S. dollars, and then we could be faced with an extremely high inflationary environment.
Fortunately, there are at least two variables helping to hold back inflation somewhat. First, banks aren’t anxious to lend out this flood of cash. While banks are hoarding cash in part because of their fear of debt-laden consumers, they are also striving to protect their capital ratios as they continue to go through massive write-downs on their assets (but of course, this circles back to our initial problem of no liquidity). Second, a weak dollar makes U.S. goods cheaper for foreign consumers and boosts exports. This increase in international demand helps produce more goods (I refer you back to the recipe for inflation). Thus, Adam Smith’s invisible hand is at work, the problem is, nobody knows for sure where the U.S. dollar equilibrium price will stabilize.
Many criticize the Fed for being more concerned about saving financial institutions and troubled mortgage borrowers than fighting inflation. Clearly, the Fed knew their actions would lead to inflation and other negative repercussions, which will have long-term consequences; but they also recognized their need to rescue the U.S. economy from a financial meltdown in the immediate short-term. While I may not agree with all of their actions, Ben Bernanke was stuck between a rock and a hard place, and I believe he has chosen the lesser of two evil decisions – the only course that prevented us from falling into a depression resembling the 1930’s. While far from over, the credit crisis will eventually end as markets clear and pricing on debt and asset-backed securities stabilizes.
Housing & the Consumer
So far, I’ve discussed the problems the housing industry has caused to the financial industry. What about the consequences to the homeowner? These lax lending standards described above fueled mortgage demand because it meant easy credit. When subprime loans started going bad, the government came up with their “rescue plan” for subprime owners facing interest rate resets to help keep them in their homes and make these loans more affordable. I find it ironic in some cases, those very same people who originally overstated their incomes to qualify for “no documentation” mortgages, were now likely understating their incomes to participate in the program!
Even more critical, though, is the excessive borrowing on the part of the majority of all homeowners. Too many Americans fell for the myth that home prices never fall, and convinced that their homes would continue to appreciate at 8-10% per year, they borrowed as much as they could using their homes as collateral. Thus, they depended on appreciating home prices to fund their spending – the birth of the “Home ATM Machine.” It is estimated that at the climax of the borrowing frenzy, American’s borrowed more than $5 trillion against their homes.
Eventually, there was a glut of homes and the bubble burst. Building permits for new homes fell to an annual rate of about 927,000, the lowest since a 921,000 rate set in March 1991, and this number seems to keep dropping. Foreclosures have now more than doubled from a year ago and existing home sales have fallen. Consequently, total home inventories have more than doubled from their typical 4-5 month supply to where they could feed sales for 11 months. According to the Case-Shilling index, this massive inventory of unsold homes has led to a nationwide year-over-year decline in housing prices beginning last December, something we have not seen since the Great Depression.
Real estate cycles typically take years to correct, and this housing slump will not be an exception. There is no evidence to imply this excess supply of homes will improve anytime soon. For one, foreclosures continue to rise from consumers who never should have qualified for mortgages in the first place. These same people who qualified during the boom will not be able to qualify this time around – in fact, there are tighter credit standards for all prospective buyers. Also, as is typical, the speculators who bought on momentum with nearly no equity will now dump their homes into the markets to cut their losses. Many buyers are simply leery of making purchases, fearing prices could continue to slide. By staying out of the market, falling home prices becomes a self-fulfilling prophecy. These factors seem to imply there will be additional pressure on prices and it’s quite possible they will overshoot to the downside, only exacerbating the problem.
And this is where the real issue begins – falling home prices. On average, American’s have about 30 percent of equity in their homes, and if home prices drop 20-30 percent, home equity for most people will be wiped out. In some cases, there are already mortgage balances now greater than the value of the home! With no equity in their homes, this means the disappearance of the “home ATM machine” and it drags down the rest of the economy.
As discussed above, the Fed took an aggressive monetary policy hoping to stimulate the economy, but instead, it seems to be only sparking inflation. Previously, when the Fed cut rates, it induced more housing construction. This time, however, there’s such a glut of unsold homes and far too many who are unable to get credit that the Fed’s massive rate cuts have not made an impact on home building activity. In fact, it’s interesting to note that while the Fed has dropped interest rates, mortgage rates have hardly changed. People should not be fooled into thinking that just because the Fed is turning up the spigot again by dropping rates and throwing money at a bear market that this will stimulate the economy this time around.
Perhaps the most worrisome concern is the outlook for the deteriorating employment situation. The residential construction market represented 30-50% of job growth over the last several years. Not only are the residential workforces declining, but there is a reduction in workforces in the financial sector as well, which represents more than 20% of the market index. We could see millions without a job, without a home, and to add salt to the wound, with high levels of debt. Unfortunately, it appears the crisis is far from over. Much of the credit problems will bleed over into consumer spending.
Consumer Spending and Debt
To save the consumer, the government came up with the tax rebate economic stimulus package which will cost taxpayers around $150 billion. I’m not convinced this stimulus plan will even make a dent – except adding to our ballooning deficit. The effect of the tax rebates will wear off soon enough, and then we will see consumers cut back on spending. In fact, I believe it’s possible we are about to witness the largest decline in consumer spending since the Great Depression. Since consumer spending accounts for approximately 70 percent of GDP (the total output of goods and services), a major slowdown in consumer spending could lead to one of the most severe recessions we have ever witnessed.
A few generations ago, there were no equity home loans and credit cards. It used to be if people wanted something, they worked hard and then paid cash. I believe much of this mentality came as a result of the Great Depression. Over time, the effect of the Great Depression wore off and little by little, the consumer was willing to take on what they felt was an appropriate amount of debt (see Chart 1 below). It appears that the amount of leverage for the average consumer reached a plateau from 1964-1984. But then came the next generation of baby boomers, and indulgence began.
There has been excessive spending for decades, and particularly in the last decade. Over the past decade, the economy has been fueled by consumers tempted into living beyond their means because of their ability to borrow at low rates against surging home prices. Consumer debt isn’t limited to the mortgage industry, however. According to the Fed’s G19 release in 2006, there’s $800 MM of credit card debt outstanding. As Chart 1 shows, consumer debt as a percentage of GDP has risen to nearly 100 percent from 23 percent in 1952! An even more telling statistic – outstanding debt to disposable income has recently soared to a record high of over 130 percent! Clearly, the economy has been running far too much on credit – all the consumption we have witnessed for decades has been driven by debt.
Spending cannot outpace income indefinitely. Eventually there is a day of reckoning. J. Reuben Clark, namesake of the Brigham Young University Law School once said, “Interest never sleeps nor sickens nor dies; it never goes to the hospital; it works on Sundays and holidays; it never takes a vacation;… it is never laid off work nor discharged from employment; it never works on reduced hours; it has no love, no sympathy, it is as hard and soulless as a granite cliff. Once in debt, interest is your constant companion every minute of the day and night; you cannot shun it or slip away from it; you cannot dismiss it; it yields neither to entreaties, demands or orders, and whenever you get in its way or cross its course or fail to meet its demands it crushes you.”2 Could it be that interest will eventually catch up, payments cannot be made, and there will be a steep change in risk tolerance that leads to a cycle seen in Chart 1 beginning all over again? Or could it be that Americans will gradually revert back to holding a more reasonable amount of debt?
At any rate, let us now imagine that in order to pay down debt, this would mean selling off assets, which would only lead to a further decline in asset prices. As home prices collapse and there is a major loss in housing wealth, the home piggy bank has disappeared and consumers won’t be able to live in fantasy land anymore. The home equity consumers have relied on for spending has simply disappeared. Additionally, credit card companies will reduce the amount they’re willing to lend to consumers and/or increase the cost of borrowing for those to whom they lend. Thus, on the credit card front, less credit available translates to a reduced consumer spending, and for those with credit, the defaults will rise.
Also, since the house is no longer as large of a nest egg, it adds pressure to save more for retirement, yet another reason to cut back on consumption. And imagine, if consumers actually began saving again, then consumer spending would really decline. Savings rate have declined over the past 50 years from about 7-8 percent to nearly 0 percent, and if they begin to increase, that would further exacerbate the restraint in consumer spending.
So far, unemployment hasn’t declined as sharply as it has heading into past recessions, but the trend doesn’t look encouraging. A deteriorating labor market will only further rein in consumer spending as consumers lose confidence regarding their job security. There is a downward spiral here. Nearly all past recessions begin with consumer spending slowing. As consumer spending declines, businesses suffer. Business inventories build, production is cut back, and unemployment rises even more. This leads to a further decline in consumer spending, and the recession runs its course. This also cascades over into other industries. Bankruptcies at the retail level leaves unpaid bills to the shipping companies, manufacturers, real estate owners, etc.
Well, consumer spending is already slowing. Most recent statistics show they have reduced their spending on durable goods and discretionary items. Additionally, we are seeing signs of consumers trading down from spending at places like Nordstrom’s to Target, and Starbucks to Dunkin’ Donuts, for example. Though, I will admit that I’m surprised the official statistics aren’t screaming an official recession by now.
For now, I believe the severity of this recession is perhaps being masked as a result of two factors. First, as mentioned, normally during a recession the manufacturing sector takes a major hit as production drops significantly and unemployment rises. However, these days, factories account for a much lower percentage of employment than they did in the past – only about 10 percent. Second, I recall a plane ride from a few months ago when I sat next to a family from Finland. They said they decided it was the right time to take a vacation in the U.S. because “it’s much cheaper here.” As discussed earlier, a weak dollar makes U.S. goods cheaper for foreign consumers, and this international demand has boosted exports, keeping U.S. factories busier than in a normal downturn. That’s good for us, but this can also cause political tensions between the U.S. and other European countries because a falling dollar in turn makes European goods more expensive to U.S. consumers, thereby reducing American demand for European goods, negatively impacting foreign economic growth.
Coming back to the main point – consumer debt is already running high and they are simply overspent! All the easy credit that fueled this decade of spending is reversing course and drying up. Falling home prices, maxed out credit cards, rising prices for necessities (discussed more below), and rising unemployment…no wonder consumers are retrenching! There’s no other option than for the consumer to significantly cut back spending. No amount of rebate checks from the government will fix this combination of problems. As the net worth of these debt-laden consumers continues to drop from deflating home prices and declining equity markets, we simply cannot count on them to pull us out of a recession, especially in the face of inflation. Instead, with the consumer representing 70 percent of GDP, they will be the driver of the recession.
YCG Response
All this doom and gloom thus far is surely begging the question – How do we protect your wealth from the effects of lower consumer spending? We focus on companies who create disposable products that are needed regardless of the economic state. In a recession, or even a possible depression, consumers will not be very interested in a new refrigerator, but they will still need to eat. These are the companies that will continue to generate free cash flow over the long-term – which is what ultimately determines stock values.
The trick is to understand which products and services are viewed by consumers as necessities. We have heard that today’s necessities were yesterday’s luxuries. So, part of the art of investing would be to understand what products consumers will ax from their spending first.
Commodity Prices & Inflation
We have already discussed how all asset classes became elevated in price, and commodities were no exception. From wheat to gold to sugar to copper to soybeans, commodity prices continue to have their day in the sun. Jim Rogers, a famous investor, believes the best place to be is commodities. There’s an uncanny resemblance between a graph of commodity prices from December 2006 to the present and a graph of the Nasdaq composite from January 1999 to March 2000. The Nasdaq subsequently dropped over 75% in the two and a half years that followed. So, are commodities in a bubble? This is a hard call – commodities are notoriously known for being difficult to predict.
Let’s take oil, for example. Oil has now surpassed $140/barrel and is making new inflation-adjusted highs. Ultimately, the price of oil goes back to Econ 101 – it’s all a function of supply and demand.
I have read oil “experts” who say that prices will top $200/barrel because demand will continue to increase while supply will decline as reserves are depleted. Despite rising prices, they claim demand will continually increase as billions of people from emerging countries begin to experience the quality of life that comes from using energy (cars, air conditioning, etc.). This argument seems plausible given that Americans currently consume about 25 barrels of oil per person annually compared to 14 barrels in Japan, 2 barrels in China, and less than 1 barrel in India.
I have also read other oil “experts” who show statistics that supply is currently outpacing demand growth and that inventories have actually been building. Oil reserves have gone up virtually every week this year and U.S. gasoline reserves are at their highest levels since the 1990s and have risen steadily since last October. They believe we are simply witnessing a boom in oil prices stemming from speculators piling in billions of dollars and that prices are ready to burst. They say that if it looks like a bubble and acts like a bubble, chances are it is a bubble, and will inevitably pop.
The fact is, even though the standard of living that comes from energy intensive goods is desirable, prices cannot go up forever and have supply and demand remain the same. Producers will react to surging oil prices with increased supply. To what extent demand changes depends upon its elasticity. Oil is a fairly inelastic good (meaning regardless of price, demand remains relatively the same), but it certainly is not perfectly inelastic. Eventually, energy conservation will take place and/or substitutes for petroleum will be found and demand will subsequently slow or even decline, leading to a drop in prices. Alternatives may include trading in gas guzzling SUVs for hybrid cars, using more car pooling, decreasing personal miles driven, finding different modes of transportation such as public transportation or even the old-fashioned bicycle, or decreasing transportation altogether. In fact, for the first time since 1979, the number of miles driven by Americans fell last March on a year-over-year basis. Additionally, there may yet be some innovations to come. As the saying goes, “Necessity is the mother of invention.” For example, I’ve heard of “plug-in” cars that should hit the markets in 2010 and while this sounds unbelievable, I’ve even heard of a company working on a product that can turn garbage into energy!
However, all of this hasn’t even factored in the dollar’s effect on oil prices, which throws in yet another critical variable to the equation. The dollar has dropped so much – is it finally oversold? Or with increasing debt levels and a flood of money into the economy, does it have further to run?
I suppose my point is: commodity prices have been cyclical for over a century and are very difficult to predict because there are numerous factors that affect the final price. Thus, making investments based upon guesses on the direction of prices simply becomes speculative, and not investing. I will be the first to admit that speculation is certainly not in my circle of competence. Therefore, I hope it brings comfort to know that I will not be making any bets on the direction of commodity prices, even if I do have an opinion about them. But, it is still my responsibility to strive to preserve your capital and protect from the consequences of rising commodity prices eating into your purchasing power (how much in goods your dollar can purchase).
If you’ve bought groceries or visited your local gas station lately, you clearly recognize inflation is a problem and not allowing your dollar to stretch as far as it used to. Surging commodity prices (the inputs) are leading to higher prices on goods purchased (the outputs), and this almost acts like a tax as you have less to spend elsewhere. Not only does this negatively affect the consumer, it hurts companies, too.
Inflation raises production costs, and if companies can’t pass along the costs to consumers, margins are squeezed. Even if they can raise prices to some extent, many businesses will still struggle with growth. Additionally, as inflation increases, so does borrowing costs. Those companies who cannot grow their business with the cash they generate internally will need to rely on borrowing to finance their operations at higher costs, and less borrowing means less capital expenditures and less growth. From another perspective, inflation leads to a consumer spending slowdown which also causes less production and capital expenditures. Ironically, the Fed’s attempt to stimulate growth by lowering interest rates is actually having the opposite effect.
Another concern would be the wage-price spiral. This is where commodity prices are squeezing margins, so companies raise prices. Then, employees demand higher wages from their employers, which increases business costs, thus companies raise prices again, and the cycle perpetuates. Hopefully, the much lower amount of labor unions these days compared to the high inflation periods of the 70’s will help keep this phenomenon under control due to less employee bargaining power.
YCG Response
Most importantly – How do we protect your portfolio from rising prices? While inflation is not good for stocks, not all companies are at the mercy of the overall economy. In fact, based on history, stocks are actually the best protection from inflation. In a Barron’s article written in the March 17, 2008 issue, Gene Epstein commented, “Housing does remain a good hedge against inflation over very long periods. Examine any 20-year stretch since 1970 and you’ll find that home prices, adjusted for inflation, rose. Inflation-adjusted stock prices generally did even better over long periods, albeit with greater volatility, a Barron’s analysis found. Surprisingly, commodities way underperformed both housing and equities as inflation hedges, notwithstanding the current run-ups in food, fuel and metals.”
But not all stocks are a great protection against inflation and fluctuating currencies – so where do we turn? First, we look for strong global companies with a high percentage of global revenues to help create a natural hedge against unpredictable currency fluctuations. In addition, companies with global revenues may help should the U.S. enter a deep recession. Metaphorically, it used to be that if the U.S. became a little nauseous, the rest of the world caught a terrible case of the flu. I believe the U.S. economy inherently still affects the rest of the world, but clearly less than the past.
Second, we look for companies with strong brand names. As long as their revenues are rising equally or faster than their variable input costs, then earnings will not be affected. Companies with strong economic goodwill have this pricing power.
Third, we look for companies with low capital requirements. Asset intensive businesses by definition require frequent, substantial maintenance capital expenditures simply to survive. During inflationary periods, it is very difficult for these companies to generate enough cash flow to feed their hungry capital reinvestment needs, which not only prevents them from paying dividends and repurchasing shares, but sends them to the capital markets looking to raise funds at high rates.
Presidential Campaign & Taxes
Markets hate uncertainty, and uncertainty leads to volatility. Fortunately, for us, volatility gives us the ability to snatch up bargains as they come along. Another wrench thrown in to create this volatility is the uncertainty of who will become elected as our next U.S. President.
The big question here is – what’s going to happen to taxes? Most people don’t realize that over the past century, the top income tax bracket rate has ranged anywhere from 7 percent (1913-1915) to 94 percent (1944-1945). History has taught us that raising taxes hurts the economy, especially during a recession. Just look to the Great Depression or the 1970’s for those devastating lessons. On the converse, the economy roared as a result of “Reaganomics” – supply-side economics that implemented several tax cuts.
Obama has stated his plan is to adopt the “Robin Hood” approach – tax the rich and redistribute the wealth to the poor and middle class. This would come in the form of higher dividend (from 15 percent to 20 percent) and capital gains taxes (from 15 percent to 20 percent or as high as 28 percent), and higher income tax brackets (top bracket from 35 percent to 39.6 percent). McCain, on the other hand, has stated he will maintain the Bush tax cuts. Whether I am Democratic or Republican, the facts remain the same. If Barack Obama wins the election and follows through with his plan to put an end to the Bush tax cuts, we have learned from the past that this will create serious repercussions on the U.S. economy. Clearly, higher taxes adds pressure to consumers’ already high debt burdens. But far more important, higher taxes will take needed investment capital out of the hands of investors, curb foreign investment, and give less incentives to the all important entrepreneur – a major source of job creation and economic growth.
Let me be clear – I am not seeking to endorse one candidate over the other. Of course, there are far more issues to be considered in choosing a candidate than taxes. I am only highlighting the critical variable of the next administration that will impact investors in the marketplace, and thus must be considered in evaluating investment strategies.
Valuation
One of the most important topics I would like to cover with you is where the general market price levels are currently. My Father has been quoted saying, “A low purchase price covers a lot of sins.” We all know the trick to investing is to buy low and sell high, so you may be wondering, is the general market currently over or undervalued relative to its true intrinsic value? To figure this out from a macro perspective, I believe the best method to use is the price to sales ratio (P/S). This is how many dollars an investor is willing to pay for one dollar of sales. A more common metric used is the price to earnings ratio (P/E). However, to study the broad market, I prefer to use P/S. The main reason is because revenues are much more difficult to manipulate through accounting than are earnings. Also, if we are to assume that investors understand over long periods of times that operating margins for the entire economy should remain fairly constant (more on this later), than this P/S metric should in theory remain the same over the years. Thus, we can roughly say the market looks inexpensive or pricey when it deviates wildly from the averages.
The P/S ratio for the entire economy is calculated by taking the entire U.S. market value divided by Gross Domestic Product (G.D.P.). U.S. market values are derived by multiplying the price of each stock by its corresponding outstanding number of shares, and adding them all up. This is how much investors are paying to own all stocks in the United States. Gross Domestic Product is by definition all revenues generated through the sale of all finished goods and services produced within the United States. Thus, Chart 2 plots the price to sales ratio on the entire economy, using quarter end statistics.
As a caveat, I should mention there are a few downsides to this graph. First, the graph is not inflation adjusted, thus, the high inflation rates of the 70’s and 80’s distorts the picture somewhat by dragging down the average P/S ratio. Second, as discussed above, tax rates have wildly fluctuated over this time period, tainting our desired “apples to apples” comparison. Obviously, if the government is taking a smaller chunk of corporate earnings and investor profits, investors would be willing to pay more for a dollar of sales. Third, a more accurate representation of how much you are paying to own a stock is done by calculating the enterprise value. This is calculated by taking the market value and then adding debt and subtracting cash. In other words, it represents how much an investor would have to pay to take a company completely private – they would need to buy all outstanding shares, pay down all debt, but they get to keep the cash on the books. This is more accurate because companies use varying levels of debt. However, on a macro level, if we assume the U.S. capital structure hasn’t severely changed over the years, the P/S graph still paints the picture fairly well.
Despite the flaws in our analysis, what lessons can we extract from this chart? First off, over the past 84 years, P/S has averaged 0.75 (the median is 0.70). This means investors, on average, have been willing to pay $0.75 for $1.00 revenue (again, this is only a rough figure given the deficiencies in our analysis). Just before the great stock market crash depression in 1929, the P/S was approximately 1.33. The P/S bottomed out in 1932 around 0.42 and in 1942 around 0.40. For the next 12 years, the stock market hardly budged. I would propose that in large part, this was because Americans were humbled by the Great Depression, and had become extremely risk averse.
Eventually, the uneasiness wore off, and by 1968, the P/S level had risen to 1.03. During this time period, Warren Buffet was known to have been warning his investment partners that bargains were difficult to find. While it took time, he was eventually vindicated and the market bottomed in 1974 with a P/S ratio of about 0.38.
It wasn’t until Ronald Reagan stimulated the economy that the P/S ratio really began to inflate. Despite the 1987 crash, memories fade quickly, especially in a prosperous economic environment. Greed set in and risk takers became aplenty. Since investors required a much lower risk premium, the stock market took off. Thus, a willingness to accept risk has led to growth and has been the driver of investment returns. Greed seems to have overtaken and created the illusion that risk is non-existent, and so prices continually go up. In other words, the phenomenal returns we’ve seen in stocks for the last several decades have NOT been because companies are producing and earning more, but because stocks have simply become expensive!
In 2000, the P/S ratio in the broad economy hit an astonishing 1.85! After the bubble burst, the P/S ratio bottomed at 0.90 in 2002. Yes, you read that correctly. Levels bottomed at what had been the peak of the late 60’s and early 70’s!
From 2002 until present, the markets have been headed only one direction. Home prices never drop, right? Stocks always go up in the long run, right? Interest rates are so low that one can assume more and more debt without consequence, right? With all this greed and speculation, by October 2007, the P/S ratio on the broad market was voted back up to 1.19 and today is about 0.95. Will we return to the higher risk premium demanded by investors of the past, or are those levels never to be seen again? I believe there will be a revulsion against risk and more cautious investor behavior. Greater risk aversion would then bring stocks back to trading within historical norms.
Corporate Profits
Now you may be wondering, “Then why have I heard from the media and other analysts that the market is cheap?” First, may I remind you that these same Wall Street professionals were saying that last year at the market peak. Obviously, the market is cheaper now than it was then. However, even at today’s levels, the market is still trading at a premium relative to the past. The problem is analysts are extrapolating returns from a peak of abnormally high profit margins.
Chart 3 shows after-tax corporate profit margins – corporate profits divided by G.D.P. Over the past 62 years, margins have averaged 6 percent (5.8 percent is the median). Today, margins are standing around a record level of 8.4 percent, a whopping 40 percent above the average. With margins 40 percent above long-term norms, current P/E ratios would only be “normal” if we assume these record profit margins are to continue.
There are many reasons why high profit margins are unsustainable. Let me focus in on the obvious. Jeremy Grantham has been quoted saying something to the effect that profit margins are one of the most reliable mean-reverting statistics in finance…if not, something is wrong with capitalism. High profits attract competition, so they can’t be high forever, unless the system isn’t functioning properly or capitalism is broken. If Grantham’s Economics 101 is correct and we take normalized earnings (essentially the average), then earnings drop and P/E’s increase and investors come to the realization that stocks are not cheap at all. In other words, a P/E multiple concocted from elevated earnings paints a very distorted valuation metric!
At the end of 2007, earnings on the S&P 500 were estimated to be $87.51. However, we know we are coming off the peak of a business cycle and corporate profits will decline. As discussed in previous sections, commodity prices are increasing and squeezing margins. Additionally, consumer spending is already slowing – auto sales are down, the airline industry is suffering, etc. So, if we take into account that this $87.51 estimate is 40% above average, the normalized earnings figure becomes $62.50. Based on a June 30 close of $1280, this changes the trailing P/E ratio from 14.6 to 20.5 – a much different picture.
Moreover, we might ask ourselves, what is the quality of this earnings estimate? I believe that even $62.50 is an overestimation of the truth when you consider stock option accounting, pension accounting, and what I affectionately call “recurring non-recurring charges.” These additional expenses that are unaccounted for likely put the “true” earnings in the range of $55 to $60. This would mean the trailing P/E ratio is in the range of 21.3 to 23.3.
YCG Response
How do we protect ourselves from declining corporate earnings as a result of operating margins returning to normal levels? First, we have to be careful when assessing the valuation of companies, and not assume lofty growth expectations, so that ultimately we do not overpay. As I love to say, “Even a great business at a high price is a poor investment.” Second, it’s critical we’re invested in businesses that have fortress balance sheets that can weather the storm when margins do get squeezed.
Prediction
After all this gloom and doom, does this mean I’m predicting a market crash, especially after it’s already fallen so much? Making predictions about the direction of the stock market is something I shy away from – I admit I do not have a crystal ball. I certainly will not predict what will happen to the market over the few months to a year, as I do not have the faintest idea. At the beginning of this letter I mentioned that on July 14, 2007 I saw the markets taking a turn for the worst over the next few months. The timing of that prediction I will consider lucky and I think I’ll stop while I’m ahead!
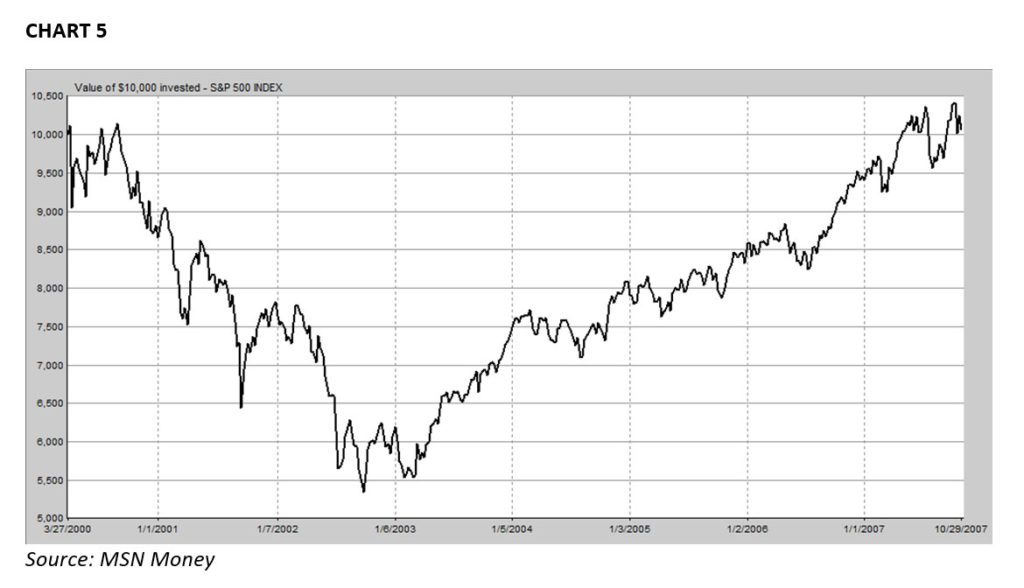
If I were to try and make that prediction, here are a few possible outcomes. It’s quite possible we could see things reverse temporarily. With all the “pump priming” that is going on we could see a short-term rally. There’s so much liquidity being pumped into the financial system – money-market funds are stuffed with nearly $3.5 trillion in cash. U.S. equity funds have seen several months of outflows, and consumer confidence has hit a 17-year low. It’s also possible that these topics we’ve discussed (and other topics we haven’t even mentioned such as terrorism and war) could lead to a major market crash, despite it having already dropped 17.6 percent from the peak. Finally, it’s possible the market could trade sideways for decades and wait until “true” earnings catch up to the current price levels. While this may sound unlikely, realize that an investment in the S&P 500 on January 1, 1973 would have returned zero percent over the next 9 years and nine months (see Chart 4 below), and that’s including dividend reinvestment! Another example, an investment in March of 2000 and liquidated in October of last year (see Chart 5) would have yielded nothing as well.
Well, there’s certainly nothing prophetic about that – I essentially said the market could go up, go down, or trade sideways! Sounds like a heads I win, tails you lose proposition. The truth is, making calls on the market is simply too difficult, there’s far too many variables in the equation. So, what do I want to predict? That from the current price level, returns over the next decade in the general market will certainly not be like the 10-11 percent annualized returns that most people have come to expect. This number is looking in the rear view mirror and not a good predictor of the future. As I stated previously, the market generated these returns from an expanding P/E multiple and by making earnings on borrowed money. As the market runs ahead of itself, the future expected returns drop.
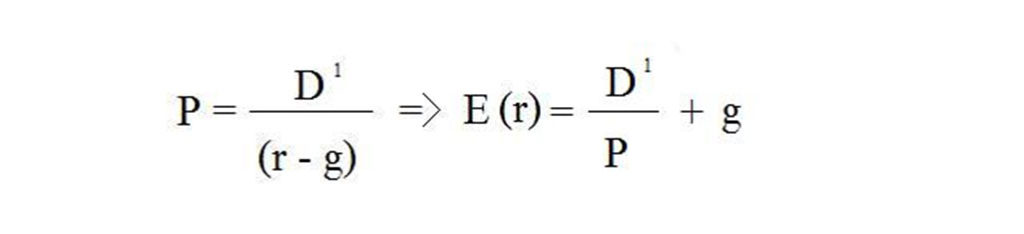
In fact, I will be so bold as to state what I believe annualized returns will be for the S&P 500 from this price level over the next several decades by using a simplistic approach. I will utilize a very popular pricing formula called the Gordon Growth model. By manipulating this formula, expected returns for the future is equal to the dividend from next year divided by the price paid for the stock, plus the growth rate.
Historically, real GDP has grown at 3.3 percent – 1.1 percent due to population growth, and 2.2 percent due to technological growth. The S&P 500 is comprised of 500 stocks that represents about 2/3 of GDP. Suppose we conservatively estimate that inflation will be 3 percent (I believe we will see higher inflation days ahead). Then, for our growth variable we will use two-thirds of 3.3 percent plus 3 percent inflation which equals 5.2 percent. The only way this number can be much higher is either we have a major technological shock (such as the railroads of decades past), or higher inflation (which obviously will not help us).
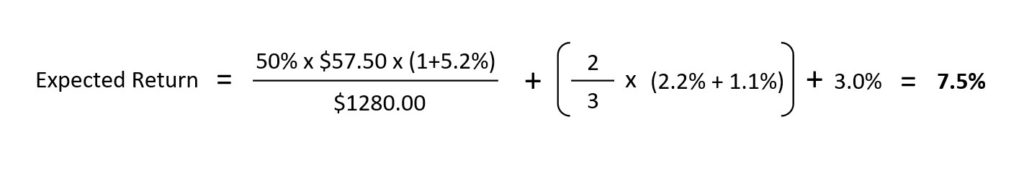
Historically, about 50 percent of earnings are paid out to investors (although, right now it’s about 30-40 percent). As we discussed in the prior section, I believe the S&P 500 is generating about $55 to $60 per share. Using a generous 50 percent of $57.50 multiplied by the expected growth rate of 5.2 percent equates to $30.25.
Therefore, using this fundamental approach, our expected rate of return is $30.25 divided by $1280.00 plus 5.2 percent which equals about 7.5 percent – and I believe this number is generous (I expect 5.5-6.0 percent using what I believe are more accurate assumptions).
If we wanted to see this number to equal the 10.2 percent from the past, while this may sound heretical, this implies the S&P 500 would need to trade around $600.00! I’m not saying this is where it is headed, but it certainly wouldn’t be out of the realm of possibilities given our history. Unfortunately, this future expected rate of return prediction cannot be evaluated for decades because the longer you wait, the more you strip out market fluctuations found in expanding and contracting P/E multiples. Also, I’m not trying to make a prediction about inflation, and if that changes, this figure needs to be adjusted.
There is a similar, but slightly different approach which leads us to the same conclusion. Text books state that nominal returns for stocks from 1926-2001 annualized 10.2 percent. This number was comprised of 3.1 percent inflation, 4.1 percent from dividends, and real capital appreciation of 2.7 percent (you multiply these figures together for 10.2 percent). Using this logic, suppose we again assume 3 percent inflation and we use the current dividend yield of 2.2 percent. Real capital appreciation is comprised of both real earnings growth and expansion of the P/E multiple. Since I do not expect an expanding P/E multiple to contribute to returns, I will assume all real capital appreciation will only come from real per share earnings growth. The approximate average over the past century is only 1 percent (the fact real capital appreciation was 2.7 percent from 1925-2001 shows just how much multiple expansion has really taken place!). Thus, 1.03 times 1.022 times 1.00 is equal to 5.3 percent. You may argue that real capital appreciation should be higher because if the dividend yield is low, this must mean more earnings payout is coming in the form of share repurchases. But remember, if the market is overvalued, repurchasing overvalued shares would actually stint growth.
I think I feel similar to what Warren Buffet must have felt in the late 60’s. In a letter dated Jan. 22, 1969 he wrote to his investment partners, “I can’t emphasize too strongly that the quality and quantity of ideas is presently at an all time low.” The actual market peak didn’t come for another 4 years, however, if you were to invest on the day he penned that letter, and then held the market for the next decade, your total return would have been zero percent. If you had held for two decades you would have returned 5.3 percent annualized and if you held until the present – 6.6 percent annualized. So, while he did not know when and at what price would be the market peak, he did know it was difficult to find bargains, a coincidental indicator of an overvalued market.
Game Plan
Clearly, there are many serious issues currently facing the economy. All of these variables lead to a great deal of uncertainty. While this letter has focused mostly upon depressing macroeconomic issues, realize this focus was to simply point out these worrisome problems and assure you that we are aware of them. But I’d like to emphasize that we are primarily bottom up investors, and therefore we do not focus on market analysis and the issues facing the overall economy. Ultimately, the investors returns come down to the individual businesses they own. You can make money in a bear market because not all companies hit their peaks and lows at the same time. Thus, while it’s important to understand the economic environment, it’s even more critical to understand how to purchase a great business at a great price.
So, to tackle the many issues before us, I would like to reiterate that we are focusing on quality companies that have low capital requirements, make branded disposable products, have high global market share, strong balance sheets, and all this at a favorable price. We believe that with this focus, we can protect your portfolio from the problems the economy is facing today.
Fortunately, the types of quality stocks that we are interested in happen to be the ones that have the best valuation. They seem to fall in the category that I call “hedge-fund abandoned” stocks. In searching for speculative returns, many of the great quality blue-chip firms with large economic moats (competitive advantages versus their peers) and global footprints have been ignored. Will you double your money overnight owning these types of businesses? No. But can you protect your capital and make decent returns at these price levels? Absolutely.
It is also important to remember that in the short run, the value of your portfolio is determined by the opinions of others. If the marketplace becomes depressed and decides to sell off shares of a business you own, thereby decreasing its share price, realize, it’s still possible the underlying value of your business hasn’t changed. In other words, if Coca-Cola goes from $65/share to $50/share in a month, you are still the proud owner of Coca-Cola shares. Clearly, Coca-Cola’s intrinsic value has not changed that much over the course of the month.
We reassure you that we are diligently seeking the best places to put your capital to work. Through our discussions above, we’re clearly in unchartered territory. In some ways, we’d like to be able to tell you that the worst is behind us because we certainly don’t want to sound pessimistic, but we also need to be realists. While it is disconcerting to see the market falling, we are optimistic as we see this as our opportunity to scoop up quality businesses at good prices – something us value-starved investors haven’t seen for a long time. As the saying goes, when the apple tree gets shaken, some good apples fall to the ground.
Well, if you’ve made it this far – Congratulations! I promise I will not bore you in the future with such lengthy letters – they will be much shorter and more about the prior quarter. I just felt that as our very first letter together, I should address many of the issues we’re currently facing from a general overview perspective. We thank you for your trust in us as we launch our new business. One thing is always uncertain – the future. And while we cannot predict the future, we can prepare. And “if ye are prepared, ye shall not fear.”
Sincerely,
The YCG Team
Disclaimer: The specific securities identified and discussed should not be considered a recommendation to purchase or sell any particular security nor were they selected based on profitability. Rather, this commentary is presented solely for the purpose of illustrating YCG’s investment approach. These commentaries contain our views and opinions at the time such commentaries were written and are subject to change thereafter. The securities discussed do not necessarily reflect current recommendations nor do they represent an account’s entire portfolio and in the aggregate may represent only a small percentage of an account’s portfolio holdings. A complete list of all securities recommended for the immediately preceding year is available upon request. These commentaries may include “forward looking statements” which may or may not be accurate in the long-term. It should not be assumed that any of the securities transactions or holdings discussed were or will prove to be profitable. S&P stands for Standard & Poor’s. All S&P data is provided “as is.” In no event, shall S&P, its affiliates or any S&P data provider have any liability of any kind in connection with the S&P data. MSCI stands for Morgan Stanley Capital International. All MSCI data is provided “as is.” In no event, shall MSCI, its affiliates or any MSCI data provider have any liability of any kind in connection with the MSCI data. Past performance is no guarantee of future results.