


The S&P 500 Index returned 4.30% in the quarter ended June 30, 2019.[1]
In our last letter, we described our investment strategy in great detail. At the end of the letter, we summarized our strategy as follows:
In summary, we believe the best way to achieve excess returns without excessive risk is to 1) identify great businesses with enduring pricing power and long-term volume growth opportunities; 2) minimize other long-term business risk factors by partnering with ownership-minded management teams and avoiding companies with aggressive capital structures; 3) avoid overpaying by focusing on the high-quality-business mispricing, by remaining vigilant to market-timing mispricings, and by comparing the forward risk-adjusted rates of returns of our businesses with our investment alternatives; 4) diversify as much as possible among the attractively-priced, great businesses we’ve identified; and, finally, 5) wait.
The natural question that follows from this description is, “What, if anything, is involved in the ‘wait’ part of your process?” For us, waiting is an active process, not a passive one. While we wait, we are performing four main investment-related tasks. We are:
- Reading and thinking about businesses that we currently don’t understand well enough to either add to or eliminate from our list of great businesses with enduring pricing power and long-term volume growth opportunities.
- Continuously updating our views on the pricing power, volume growth opportunities, management alignment, capital structure, and valuation of our existing positions as new data presents itself.
- Reading economic, social, and political history as well as expert commentary on the current environment. We engage in this activity not because we believe any of this reading will be predictive (we don’t) but rather because we believe it helps us to better understand the range of potential future economic, social, and political outcomes. This understanding, in turn, helps us to evaluate our current portfolio construction and identify any weak spots.
- Finally, where appropriate given tax considerations, rebalancing our portfolio if we identify any areas where we believe investors are over-discounting temporary macroeconomic or operational issues, leading to what we refer to as a market-timing mispricing.
In this letter, we’re going to highlight this last investment-related task, since market developments have given us a number of rebalancing opportunities in recent quarters.
Portfolio Rebalancing
While you wouldn’t know it from looking at the S&P 500 Index return of 2.51% over the last nine months,[2] the markets were anything but calm during this period. Starting in October, the market began to sell off. Then, in December, the sell-off accelerated as investors panicked over the combination of weakening economic data and the Federal Reserve’s seeming resoluteness to continue raising interest rates despite this weakness. The Federal Reserve’s stated game plan was particularly worrying to investors since higher interest rates can sometimes have a doubly negative impact on stock prices. First, higher interest rates make getting a loan more expensive, so fewer people and businesses will borrow money to spend and invest, slowing economic activity. When economic activity is already slowing, as it has been, it can send the economy into a recession, temporarily hurting the profitability of companies listed on the stock market. Second, when interest rates rise on U.S. government debt, the price investors are willing to pay for other assets such as stocks sometimes decreases. This result occurs because U.S. government debt is one of investors’ main alternatives to these other assets. Therefore, when the U.S. government offers investors an incrementally more attractive rate of return on its debt, stocks and other assets are often repriced downward so that they also offer an incrementally more attractive rate of return.
At its worst point in December, the S&P 500 Index had declined by 20% from its September 21st peak, which many investors view as the level of decline required to label a market environment as a “bear” market. It was in this December market panic that we got our first rebalancing opportunity. While most stock prices had decreased, stocks in the economically-sensitive luxury goods sector were particularly weak. On the other hand, many of our economically-resilient consumer staples held up much better. Despite possessing no clairvoyance about future economic activity or stock market returns, we believe we were able to use these price movements to enhance your portfolio’s risk-adjusted return profile. This opportunity occurred because, on the macro- and micro-scale, we believe investors tend to over-discount the near-term economic outlook. On the macro-scale, investor attempts to avoid temporary economic downturns by going to cash lead to great buying opportunities in the stock market as a whole. Similarly, on the micro-scale, we believe investor attempts to avoid temporary headwinds in good businesses and industries lead to great buying opportunities in individual stocks. Therefore, given our confidence in luxury goods’ long-term pricing power and volume growth opportunities, we trimmed some of our consumer staples holdings to fund purchases in our favorite luxury goods businesses.
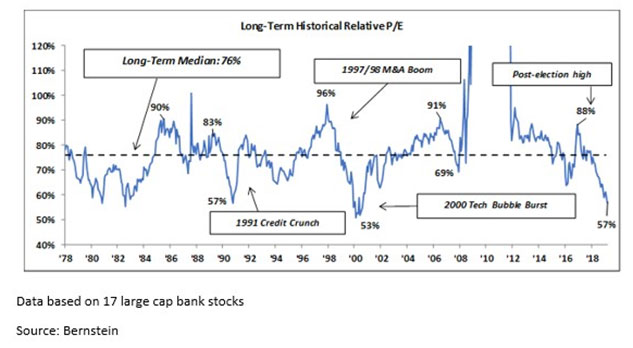
Fast forward to the present. As of this writing, the Federal Reserve has completely reversed its stance on interest rates, having given the market numerous assurances that it is willing to lower interest rates to support the economy. In fact, investors now expect multiple interest rate cuts by the end of the year.[3] As a result, our luxury goods stocks, in addition to many of our other stocks with similar characteristics (high returns on invested capital, good growth, and cash flows that are generally positively affected by lower interest rates) have been bid up. However, another group of our stocks, the banks and brokerages, whose cash flows are negatively affected by lower interest rates, have been left behind. Just like in December with the luxury goods stocks, we think investors are over-discounting the short-to medium-term headwinds that these businesses face, and we believe investors are getting a great opportunity to increase their exposure to these stocks. As evidence of the market over-discounting these temporary headwinds, we’d note that, on a price-to-earnings basis, the U.S. large cap banks are almost the cheapest they’ve been versus the S&P 500 in 40 years, as the chart below shows.[4]
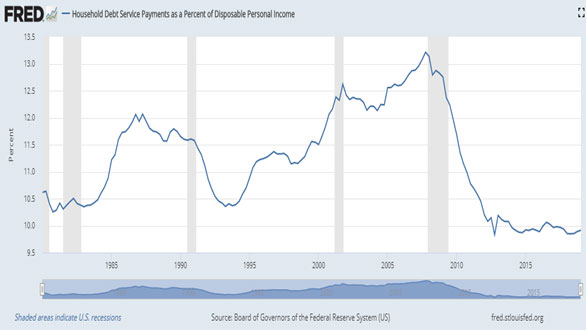
We’d also note that this valuation gap is occurring despite the fact that the U.S. large cap banks are currently earning strong mid- to high-teens returns on tangible equity that we think are quite sustainable given the banks’ much lower leverage[5] and much higher liquidity[6] post the financial crisis as well as a much healthier average U.S. consumer than has existed in a long time, as you can see in the chart below.[7]
Therefore, where appropriate given client tax and spending considerations, we’ve added to these holdings.
Concluding thoughts
As you probably noticed from the above portfolio rebalancing discussion, it seems like, at any given time, we always have a group of stocks that are underperforming the stock market. This state-of-affairs is as it should be. Since we attempt to construct a portfolio that is robust to numerous economic outcomes, we should expect that we will always have some stocks that are underperforming the market. If we don’t, it actually sends up warning flags in our minds that we might be too levered to a particular economic outcome.
Also, we hope we’ve shown that waiting, far from being a passive “do nothing” approach, is a time- and labor-intensive process that includes much analysis as well as vigilant market observation. While few trades may occur in any given period, we are always hard at work preparing for the rare opportunities that justify the tax and trading costs associated with portfolio activity.
As always, know we’re invested right alongside you, and please let us know if there is anything you need. We are here to help.
Sincerely,
The YCG Team
Disclaimer: The specific securities identified and discussed should not be considered a recommendation to purchase or sell any particular security nor were they selected based on profitability. Rather, this commentary is presented solely for the purpose of illustrating YCG’s investment approach. These commentaries contain our views and opinions at the time such commentaries were written and are subject to change thereafter. The securities discussed do not necessarily reflect current recommendations nor do they represent an account’s entire portfolio and in the aggregate may represent only a small percentage of an account’s portfolio holdings. A complete list of all securities recommended for the immediately preceding year is available upon request. These commentaries may include “forward looking statements” which may or may not be accurate in the long-term. It should not be assumed that any of the securities transactions or holdings discussed were or will prove to be profitable. S&P stands for Standard & Poor’s. All S&P data is provided “as is.” In no event, shall S&P, its affiliates or any S&P data provider have any liability of any kind in connection with the S&P data. MSCI stands for Morgan Stanley Capital International. All MSCI data is provided “as is.” In no event, shall MSCI, its affiliates or any MSCI data provider have any liability of any kind in connection with the MSCI data. Past performance is no guarantee of future results.
[1] For information on the performance of our separate account composite strategies, please visit www.ycginvestments.com/performance. For information about your specific account performance, please contact us at (512) 505-2347 or email [email protected]. All returns are in USD unless otherwise stated.
[2] The period from September 30, 2018 to June 30, 2019.
[3] See https://www.depositaccounts.com/blog/fed-deposit-interest-rate-predictions/.
[4] See https://theotrade.com/banks-the-cheapest-versus-overall-stock-market-in-40-years/.
[5] See https://www.fdic.gov/about/learn/board/hoenig/capitalizationratio4q17.pdf.
[6] See https://www.bloomberg.com/quicktake/bank-liquidity.
[7] See https://fred.stlouisfed.org/series/TDSP. Data from January 1, 1980 to January 1, 2019.