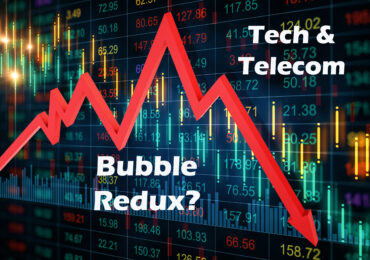


The S&P 500 Index returned -4.60% and the S&P Global Broad Market Index returned -5.55% in the quarter ended March 31, 2022.1
While the quarterly index returns cited above suggest a fairly quiet quarter, they belie huge moves under the surface, many of which were catalyzed or reinforced by Russia’s invasion of Ukraine. A few notable examples include the S&P 500 Energy Index, which was up 39.03% during the quarter, the Wedbush ETFMG Global Cloud Technology ETF (IVES), which was down -16.12%, the iShares Genomics Immunology and Healthcare ETF (IDNA), which was down -21.36%, and the most amazing of them all, the iShares MSCI Russia ETF (ERUS), which was down -81% through March 4,2 at which point it ceased trading altogether.
So, what’s going on? Because of the war in Ukraine, we can add energy supply shocks to the already long list of building inflationary forces, which includes COVID supply chain disruptions, massive fiscal stimulus, negative real rates, and the worst worker shortage since World War 2.3 As a result of these mounting pressures, the Federal Reserve has committed to a plan to raise the Fed Funds rate (commonly viewed as the “risk-free” rate) over the next few years by more than was previously expected. Since all assets are in competition with each other for investment dollars, when the risk-free rate rises, investors are, all else equal, willing to pay somewhat less to take on risk. However, not all assets respond equally to risk-free rate increases. To understand why, it’s helpful to look at the two main sources of investment risk: cash flow risk and duration risk.
Cash flow risk is the risk that our assets’ cash flows don’t actually show up at the times and in the amounts that we expected when we made our investments. These disappointments most often occur because of competition, unexpected economic environments, mismanagement, misappraisals of an industry or category’s future growth, poor corporate governance, and government confiscation/sanction.4 Conspicuously absent from this list, as you’ve likely noticed, are risk-free rate increases. The reason we’ve excluded this risk factor is not because cash flows aren’t impacted by changes in the risk-free rate. They most certainly are. Rather, it’s because these impacts are oftentimes complex and hard-to-predict.
Duration risk, on the other hand, has a much more straightforward relationship with the risk-free rate. Duration risk is the risk that the risk-free rate increases and makes future cash flows less valuable. To understand why this is the case, consider a simple example in which one investment pays $100 today and another pays $100 two decades from now. Clearly, the $100 today would be preferred, because not only would people prefer cash now, but they could also reinvest that cash and earn more. Thus, to quantify by how much less that cash in the future is worth compared to cash now, investors “discount” that future cash by a rate of return. The higher rates go, the more they discount those future cash flows, making them worth even less in comparison to cash today. As a result of this dynamic, the further out in time investors expect to receive cash flows from a business, the more the business’s value is negatively impacted by rising rates. In other words, growth companies whose value is largely dependent upon future growth are more leveraged to rising rates and thus more subject to valuation compression when interest rates rise. With this context, it should now make sense why the least-profitable, highest-growth businesses, such as those in the Wedbush ETFMG Global Cloud Technology and iShares Genomics Immunology and Healthcare ETFs that we mentioned earlier in the letter, performed poorly in the first quarter.
Now that we’ve discussed what’s happening, the natural next question is, “What portfolio changes is YCG making to respond to rising inflation and rates?” And the answer is, “Not many.” We believe inflation is an incredibly complex phenomenon that no one can accurately predict. If you want to understand why in more detail, please refer back to our Q2 2021 letter.5 Frankly, for the same reasons that we mentioned in that letter, we include most other macroeconomic variables, such as GDP growth, interest rates, unemployment rates, and so on in the “unpredictable” bucket. Therefore, just because we’re experiencing inflation, GDP growth, and low unemployment today, it doesn’t follow that we’ll be experiencing these conditions a year from now. In fact, during the last few years, we’ve received an object lesson in this unpredictability. We went from a fairly strong global economy pre-COVID to an economy on the verge of a second Great Depression to a roaring economy to an economy today that is growing but with high and rising inflation that many experts fear will choke off growth and cause a high-inflation economic stagnation (a “stagflation”). On the other hand, given how levered our economy is to low rates, it’s possible that the meager rate rises that the Fed plans could cause a bad enough recession that we tip all the way back into deflation, making next year’s economy look entirely different yet again.
What follows from this radical uncertainty about the future is that our goal should be to consider as many possible futures as we can and to then design a portfolio that we think can protect and grow our purchasing power in as many of these future scenarios as possible. And that’s what we’ve tried to do. In designing our strategy and our current portfolio, we have considered hyperinflation, recession, depression, strong real economic growth, weak real economic growth, high interest rates, low interest rates, war, peace, China dethroning the United States as the largest economy in the world, and many other scenarios. And, after completing this exercise, our portfolio that is focused on global champions with enduring pricing power, long-term volume growth opportunities, conservative balance sheets, and ownership-minded management teams and that is diversified across geography, industry, category, and macroeconomic factors is the best portfolio we can come up with to maintain and grow our purchasing power across as wide a range of scenarios as possible.
We have discussed a number of these scenarios and why we think our portfolio is well-positioned to deal with them in past letters. However, we’ve never discussed stagflation specifically, and given that it’s the “risk du jour,” we will endeavor to tackle its impact on our businesses in this letter. In order to accomplish this task, it’s helpful to divide our portfolio’s investment risks into the two categories mentioned earlier: cash flow risk and duration risk. Let’s take them in reverse order since duration risk is more straightforward.
Duration Risk
Because we focus on businesses with enduring pricing power and long-term volume growth opportunities, investors tend to ascribe more value to our businesses’ future cash flows than they do to the average business. Since, as we saw from the exercise above, future cash flows get more discounted when rates rise than do current cash flows, the businesses we own tend to experience more valuation pressure from rising rates than the average business—though, because of our businesses’ large current cash flows as well as the strong-but-not-blazingly-fast revenue growth that typifies the dominant and somewhat more mature businesses we favor, not nearly as much pressure as the unprofitable, hypergrowth companies in the cloud and genomics ETFs that we mentioned earlier. However, to reiterate, there’s no getting around the fact that the businesses we own tend to experience more duration risk than the average business.
Cash Flow Risk
Fortunately, we have designed our strategy in such a way that the other investment risk, cash flow risk, can hopefully be an “upside” risk in most scenarios, including in the rising inflation and interest rate environment that we’re currently experiencing. We believe this upside risk comes from four main sources.
First, and most fundamentally, we believe the cash flow of our businesses is underestimated and undervalued because we think investors, on average, want to get rich quickly and are overconfident about their abilities. Therefore, they tend to overvalue risky stocks and undervalue the stocks of businesses with high and sustainable returns. In other words, investors tend to underestimate and undervalue the size and duration of the cash flows these businesses can produce over time. We call this the High-Quality Mispricing. And we think the most high- and sustainably-returning businesses tend to be those that own a dominant network in an industry growing at least as fast as GDP, which we think enables these businesses to raise their prices more often and by higher amounts than investors expect.
We believe this forecasting error occurs because the exponential growth in the value of networks, while understood in concept, is underappreciated in practice. This is because humans systematically “underestimate the magnitude of compounding interest” and “are overconfident in their ability to answer questions that involve exponential growth,” as Matthew Levy and Joshua Tasoff convincingly demonstrate in one6 of the many studies that confirm this psychological bias. A famous story, the first version of which was recorded in 1256, saliently illustrates our failings when it comes to exponential growth.7 In this tale, a great king offers the inventor of chess a reward of his choosing. The wise inventor asks the king to have his servants place one grain of wheat on the first chess square and to double this amount on each additional square. The king laughs, thinking this a meager reward, and agrees immediately. However, by the time his servants reach the 32nd square, the king is no longer laughing as he is now on the hook for more than four billion grains of wheat. Shortly thereafter, the king realizes he has nowhere near enough wheat to pay the reward. In fact, to pay the reward, the king would have needed 18,446,744,073,709,551,615 grains of wheat, which is approximately 1,536 times the 2019 global production of wheat.8
As a result of humanity’s exponential-growth bias, we think businesses that own dominant networks typically raise prices much more slowly than the growth in the value of their network warrants. An example that we’ve cited before is S&P Global, which charges approximately 7 basis points per year to rate corporate bonds9 but where data suggests their rating network saves issuers 30 to 50 basis points of interest cost per year.10 Therefore, during periods of slow economic growth and/or fast inflation, businesses that own dominant networks tend to have significant unutilized pricing power that allows them to raise prices and surprise investors. The experience of our luxury goods companies during COVID is a great demonstration of this point. They posted much stronger earnings results over the last two years than investors were expecting after COVID first hit, and major factors in these positive earnings surprises were both the size and number of unexpected price increases11 that the companies were able to take because of the big gap between the prices they were charging and the value of the dominant networks they had created. In fact, some luxury goods companies had so much untapped pricing power that they were able to nearly double the prices of their most coveted items during this period with seemingly no drop in demand.12 Furthermore, as the years go by and our businesses’ networks hopefully keep expanding, we believe investors, similar to the king in the wheat and chessboard story, are likely to continually underestimate the growth in network value that is occurring, and, consequently, the duration and degree of our companies’ price increases. While we think greater-than-expected pricing power is likely to be the first and biggest source of our companies’ cash flow surprises, we believe our companies possess a number of other sources of potential upside surprise.
The second source of cash flow upside that we think we are likely to receive from owning a diverse collection of businesses that earn high and sustainable returns, possess conservative balance sheets, and produce large amounts of current cash flow comes from our companies’ unique ability to take advantage of extreme economic and stock market environments. Extreme economic and stock market environments tend to create financial distress for weaker industry players, enabling our companies to increase their long-term cash flows by taking market share from or even acquiring these distressed competitors. Additionally, our companies can use extreme stock market distress to buy back stock at very cheap prices. Since extreme economic environments are relatively rare, the timing of their onset is unknown, and the likelihood of companies being able and willing to take advantage of these bad times is hard to gauge, we believe investors tend to undervalue these characteristics, especially during good times when the fear of missing out is stronger than the fear of bankrupting out.
Third, many of our businesses have substantial net cash positions. As rates rise and as the bills and bonds in which this cash is currently invested mature, our companies can reinvest at the new higher rates, providing, in some cases, a considerable additional earnings source. For instance, Google has roughly $150 billion in net cash. Of this amount, approximately $115 billion is invested in cash and marketable debt securities. If rates were to rise by 10%—an extreme but certainly possible case—Google could eventually earn an additional $11.5 billion, which would be a 13% increase over Google’s last twelve months pretax profit of $91 billion.
Lastly, some of the businesses we own have earnings that are clearly positively correlated to higher inflation and interest rates. For instance, our bank and brokerage companies take in deposits and then invest this money in loans and securities, earning a spread. In a rising rate environment, because of switching costs and network effects, these businesses are typically able to increase the rates they earn on their loans and securities at a faster pace than the rates they must pay to retain their depositors. This deposit-rate lag widens the spread these businesses earn, increasing profits by, in many cases, double-digit percentages and, in some cases, triple-digit percentages. As another example, our insurance brokerages typically benefit in two ways. The inflationary forces that cause central banks to raise risk-free rates also cause the claims expenses of insurance companies to rise since goods and services are more expensive to replace if they are damaged or stolen. These rising expenses cause insurance companies to raise the insurance premiums they charge. Since Aon and Marsh Mac take on no underwriting risk but instead receive a percentage of these now higher insurance premiums, their earnings tend to increase during these periods. Additionally, as part of Aon’s role as a broker, Aon takes cash from its corporate customers and pays its insurance providers. While it only holds this cash for a very short time, Aon processes so many transactions that it always has a meaningful amount of customer cash on its balance sheet. Aon’s customers allow it to invest this money at risk-free rates. Therefore, when the risk-free rate rises, Aon is able to earn more money on this “float.” Finally, the geopolitical events that are often partly the cause of rising inflation and risk-free rates typically remind people of risks they took for granted in good times and occasionally unearth new risks, stimulating demand for more insurance and further bolstering the earnings of the insurance brokerages.
Concluding Thoughts
Two years ago, the world was experiencing deflation, U.S. unemployment was the highest since the Great Depression,13 oil prices were below zero for the first time in history,14 and experts were warning that we were possibly entering the worst depression since the 1930s.15 Today, we’re experiencing the highest inflation in 40 years,16 the U.S. is in the middle of the biggest labor shortage since World War 2,17 oil prices are above $100 a barrel, and experts are warning that we could be entering the worst stagflation since the 1970s.18 Clearly, our world is radically unpredictable. In such a world, we believe the best approach is to own a portfolio that can, over the long term, maintain and grow one’s purchasing power across as many economic scenarios as possible. We believe our portfolio comprised of a diverse collection of global champions with 1) enduring pricing power, 2) volume growth opportunities, 3) conservative balance sheets, and 4) ownership-minded management teams is both resilient enough and underpriced enough to accomplish this goal. While each of the four characteristics listed above are critical to our goal of growing our purchasing power across a wide range of economic scenarios, we believe that our companies’ enduring pricing power derived from owning dominant networks in industries growing at least as fast as GDP is the biggest source of this resilience and underpricing. Because of humanity’s exponential growth bias, we believe our companies can raise prices and protect profitability much more easily during extreme economic scenarios than the average company can. As a result, we believe our companies have much-better-than-average chances not only of surviving these periods but, also, of generating upside cash flow surprises during them. This combination of resilience and upside optionality makes us quite comfortable with our current portfolio, even in the face of the stagflation scenario that we appear to be entering. We hope this letter has helped you to achieve similar understanding and comfort.
As always, if you have any questions or concerns about this letter or any other matter, please reach out to us. We’re here to help. Finally, thank you so much for your trust, know we’re invested right alongside you, and we hope you’re having a wonderful spring season!
Sincerely,
The YCG Team
Disclaimer: The specific securities identified and discussed should not be considered a recommendation to purchase or sell any particular security nor were they selected based on profitability. Rather, this commentary is presented solely for the purpose of illustrating YCG’s investment approach. These commentaries contain our views and opinions at the time such commentaries were written and are subject to change thereafter. The securities discussed do not necessarily reflect current recommendations nor do they represent an account’s entire portfolio and, in the aggregate, may represent only a small percentage of an account’s portfolio holdings. A complete list of all securities recommended for the immediately preceding year is available upon request. These commentaries may include “forward looking statements” which may or may not be accurate in the long-term. It should not be assumed that any of the securities transactions or holdings discussed were or will prove to be profitable. S&P stands for Standard & Poor’s. All S&P data is provided “as is.” In no event, shall S&P, its affiliates or any S&P data provider have any liability of any kind in connection with the S&P data. MSCI stands for Morgan Stanley Capital International. All MSCI data is provided “as is.” In no event, shall MSCI, its affiliates or any MSCI data provider have any liability of any kind in connection with the MSCI data. Past performance is no guarantee of future results.
1 For information on the performance of our separate account composite strategies, please visit www.ycginvestments.com/performance. For information about your specific account performance, please contact us at (512) 505-2347 or email [email protected]. All returns are in USD unless otherwise stated.
2 See https://www.yahoo.com/now/trading-ishares-msci-russia-etf-120000841.html.
3 See https://www.foxbusiness.com/economy/us-worker-shortage-goldman-sachs.
4 Look no further than the Russian ETF mentioned above for a dramatic, real-time example of this last risk.
5 See https://ycginvestments.com/2021-q2-investment-letter-inflation/.
6 See http://eprints.lse.ac.uk/68881/.
7 See https://quatr.us/islam/islamic-story-wheat-chessboard.htm.
8 See https://en.wikipedia.org/wiki/Wheat_and_chessboard_problem.
9 See https://web.archive.org/web/20191031183406/https://www.standardandpoors.com/en_US/delegate/getPDF?articleId=2148688&type=COMMENTS&subType=REGULATORY.
10 In 2012, for the first time in its history, Heineken decided to get its debt rated. Based on Heineken’s post-mortem analysis, getting its debt rated saved the company 30 to 50 basis points of yearly interest cost. See https://web.archive.org/web/20170812220336/http://treasurytoday.com/2013/02/do-companies-need-to-be-rated-to-issue-bonds.
11 See https://www.voguebusiness.com/companies/price-increase-china-louis-vuitton-chanel-gucci-covid-19, https://www.forbes.com/sites/pamdanziger/2022/03/12/forget-quality-and-sustainability-high-price-drives-consumer-demand-for-luxury-brands/?sh=1d2cc13d3da5, https://www.dailysabah.com/business/economy/luxury-clothing-sector-undaunted-by-covid-19-soaring-inflation, https://www.scmp.com/magazines/style/luxury/article/3127998/real-reason-louis-vuitton-and-chanel-are-raising-their, and https://www.businessoffashion.com/briefings/luxury/why-luxury-brands-are-raising-prices-in-a-pandemic/.
12 See https://www.reuters.com/business/retail-consumer/chanel-increases-prices-again-europe-asia-2022-03-04/.
13 See https://www.cnbc.com/2020/05/19/unemployment-today-vs-the-great-depression-how-do-the-eras-compare.html.
14 See https://www.npr.org/2020/04/21/839522390/u-s-oil-prices-fall-below-zero-for-the-first-time-in-history.
15 See https://www.npr.org/sections/coronavirus-live-updates/2020/04/14/833995714/imf-warns-of-steepest-downturn-since-the-great-depression.
16 See https://apnews.com/article/business-long-beach-inflation-prices-consumer-prices-d412bcce554693de469765b34351773d.
17 See https://www.businessinsider.com/biggest-labor-shortage-since-ww2-goldman-sachs-workers-jobs-employment-2022-2.
18 See https://www.forbes.com/sites/sergeiklebnikov/2022/03/15/most-wall-street-experts-now-predict-stagflation-heres-what-that-means-for-investors-and-the-us-economy/?sh=6dfd40fe1400.