

Wild swings in stock prices made last quarter reminiscent of late 2008 and early 2009, with volatility that would make even seasoned mariners nauseous. Even so-called safe havens, such as gold and the Swiss franc, dropped towards the end of the quarter. It all began with talks of a U.S. default during a debt ceiling debacle when the U.S. lost the top-notch, triple-A credit rating it held for 70 years – though we do not blame the rating agency, Standard and Poors, for stating the obvious. Surprisingly, rates actually dropped to record lows as investors fled for safety (the reverse is normally true for a country whose debt is downgraded). Ironically, at the same time there is recognition of the need for government belt-tightening, an economy reliant on stimulus seems to be begging for another government bail-out as economic momentum is slowing at home. Meanwhile, the depth of the European sovereign debt crisis abroad is unnerving investors.
During this tumultuous quarter, the S&P 500 dropped a staggering 13.87%, compared to the 8.77% loss for YCG composites on average. Calendar year-to-date, YCG composites declined 2.20% on average compared to an 8.68% loss for the S&P 500. Barron’s recently quoted Louise Yamada, who wrote, “There are only two losses one can experience: capital and opportunity. If we can protect the capital, there will always be another opportunity.” While we are never pleased to experience declines, we are pleased to have held up well on the downside, which provides us with more capital to invest as opportunities surface. While there were many such opportunities last quarter, we describe two below.
HP: Reinvent
Investor sentiment has drawn a dark cloud over Hewlett Packard (HP) due to poor execution, boardroom drama, and numerous questions remaining over their strategy. To be sure, permanent impairment took place last quarter when HP decided to acquire Autonomy, a U.K. software company, for $10 billion in cash. Consider that management could have used that cash to repurchase their own shares at about 5 times earnings instead of purchasing Autonomy for about 50 times earnings. Had they repurchased their own shares, earnings per share would have increased approximately 25%, whereas the Autonomy purchase only adds about 2.5%! Granted, the opportunity in their shares came as a result of the announcement, but even prior to the announcement, an investment in their own shares would have provided a much better use of capital than overpaying for Autonomy.
With Meg Whitman as new CEO, the question remains whether or not they will spin-off their personal-computer business. While we view this decision as important, HP is much more than a computer business. We are attracted to the breadth and diversity of the company because in addition to PCs, they have a powerful mix of businesses including IT & BPO (Business Processing Outsourcing) services, printers & ink cartridges, storage and servers, software, other handheld devices, and networking. Specifically, as of their last fiscal year end, while PCs and related sales were 32% of revenue, they only made up a mere 13% of profit. Services made up 36% of profit and imaging and printing made up 28%. Clearly, the core business at HP has been evolving towards a service business, similar to IBM’s recent success with a similar transition.
We recognize HP as a company with a strong brand (albeit now a little weaker as a result of recent controversial decisions), solid balance sheet, great earnings, and well positioned to succeed in the future. Currently, however, short-term investor fears are causing HP to trade at a price that is simply too cheap to ignore. Despite the legitimate concerns that have caused some permanent impairment to HP’s value, we believe the market is giving us an opportune time to scoop up shares for this otherwise great company.
A Non-Bank Bank
Bank of New York Mellon’s (BNY Mellon) stock has taken a beating as of late as it continues to be clumped in with other banks and broader market fears regarding mortgage losses, industry regulation, and spread net interest income. Additionally, recent news has drawn a negative focus on BNY Mellon’s lawsuits regarding improper foreign exchange fees (which is less than 7.5% of the company’s revenue, and only a small portion of that 7.5% is under scrutiny), and its decision to begin charging fees for some larger deposits (Essentially, BNY Mellon is passing on the cost of having the deposits FDIC insured).
However, BNY Mellon is not a traditional bank since it does very little lending. In fact, only about 20% of its revenue comes from spread net interest. The remaining 80% of their revenues comes from fees generated by a core business of custodial services for large institutions, asset management and private banking. Since such operations do not carry any credit risk and less fear of regulation, they provide a steady revenue stream compared to traditional banks. Furthermore, since BNY Mellon is not a classic lending and deposit bank and has little exposure to mortgages, it has avoided the credit issues that have plagued the banking industry in recent years. This makes BNY Mellon more of a defensive play in the financial industry because it simply does not carry the same level of risk and accounting uncertainty associated with other banks. And while Bernanke has committed to keep short-term interest rates low for years to come, whenever interest rates do begin to finally rise and normalize, the 20% of the bank’s revenue that comes from spread net interest will actually be an additional boost to the company’s earnings power (as opposed to most banks where rising interest rates and a flat yield curve can be detrimental).
Also, news of the sudden departure of CEO Robert Kelly hit the headlines last quarter. A change in management could be a good thing by reinvigorating the company and encouraging better collaboration that could raise future profitability.
BNY Mellon is definitely credit-worthy of a look at its current valuation. Its price suggests the bank is in the same pond as struggling traditional banks when in fact it is quite different. In this case, such stereotyping can breed an opportunity for value investors.
Valuing the S&P 500
Shortly after the precipitous drop in stock prices, we found it comical that we received an email that explained why it was believed the market would catapult to new highs, and on the same day we received another email that explained why the market would reach new lows. We claim no clairvoyance on the matter, as our focus remains on picking individual stocks. However, we occasionally like to take a step back to see if the broad market is over or undervalued to help paint a backdrop to our current environment. Last quarter, our letter explained why the market appeared to have hit new all-time highs, even though the S&P 500 was trading far below its previous all-time high. The market has since dropped 17 percent from the May high, and we are frequently hearing the media state that stocks are now cheap. Normally, they cite that trailing 1-year earnings on the S&P 500 index are estimated to be $87.98 at the end of the third quarter, thus trading at a P/E multiple of 12.9, compared to a historical average of 15 to 16.
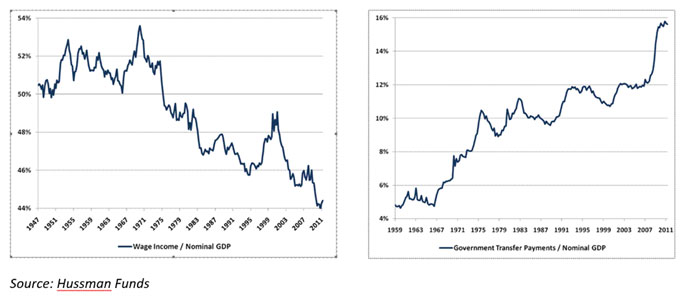
We believe this statistic is deceiving – it must be understood that these earnings are being produced during a time of peak operating margins. We all know there are business cycles – times of booms and bust. Historically, margins for the largest 500 companies have fluctuated between 5.5% and 7.5%. By definition, capitalism has reliably kept this a very mean-reverting statistic. Most recent data implies a new record with margins around 9%! This has come as a result of vicious cost cutting measures taken during the downturn, primarily through job cuts; but now that companies are lean, they will find it difficult to grow earnings through more cost cutting. One might reasonably ask, “If employee compensation has dropped, how are consumers still spending to maintain wide corporate profit margins?” A friend of mine, John Hussman, explains “Government transfer payments are now substituting for wage income to the greatest extent ever observed in history. In effect, the elevated level of profit margins is largely a reflection of government deficits that maintain transfer payments…” (transfer payments refers to welfare, unemployment, social security, etc.). You can see this graphically below.
We believe it is dangerous to extrapolate growth in profits from a peak under the assumption this trend can prevail forever, particularly when our government is funding these payments through massive deficits. When you “normalize” profits, the resulting P/E is 17.2, making the market switch from looking cheap to overpriced!
In citing that the market is cheap, sometimes analysts are even more aggressive stating 2012 operating earnings are estimated to be $111.46, putting a 10.2 multiple on the market. In addition to the problem explained above, there are two additional flaws with this “Pollyanna” approach. First, they are comparing a forward P/E to trailing P/E’s, which will obviously appear lower due to growth expectations. More importantly, they are looking at operating earnings which exclude non-recurring charges – the trouble is, ironically, these are recurring and should not be excluded. One would think since depreciation is a non-cash charge, analysts might remove it from earnings estimates, but they do not because it is estimating capital expenditures which are a true cash charge. Equally, they should not remove extraordinary charges because they are simply deferred depreciation taken up front instead of over the life of the asset. These are real expenses because these assets have become unproductive. Likewise, if the expense is related to acquisition costs, it would not be wise to assume managers will never overpay for acquisitions in the future, particularly in aggregate. Analysts desire to disregard these charges create lofty earnings expectations that are unrealistic, artificially bringing down P/E ratios.
So, how can we value the S&P 500? Ultimately, the value is whatever someone is willing to pay. From 1871 to present, historically market participants have on average been willing to pay 14.5 times trailing earnings (if you delete extreme bubble outliers of P/E’s over 26, a level markets never traded above until recently, so we remove them to prevent distortion of the average). Trailing sales on the index were recently $1007.77/share, multiplied by a normalized profit margin of 6.5%, obtains normalized earnings of $65.51/share. A P/E of 14.5 implies a fair market value of $950, or 16% below the current price of $1,131.42.
A more sophisticated method commonly used to strip out the effect of business cycles was developed by Yale economist Robert Shiller, where he takes an average of the trailing 10 years of earnings, adjusted for inflation (referred to as CAPE, or cyclically adjusted P/E). Historically, the CAPE has averaged 15.8 (median) to 16.4 (average). With 10-year, inflation-adjusted, average earnings currently at $59.48, interestingly, this implies a fair value between $940 and $976 for the S&P 500 index.
We should point out that we do not use this analysis to help us determine whether or not we should be buying stocks. For starters, the market can remain over or undervalued for many years. We prefer to look at things from the perspective, “What forward return can I expect if I buy at this price level?” Without running through the details, we estimate forward annualized real returns on the S&P 500 index to be 4% over the coming decade(s) if you bought at today’s prevailing price – you can only earn what cash is generated and delivered to shareholders. The only way you can achieve higher returns is if there is a major technological shock such as the railroads, which transformed our economy to another level (or you rely on trading at bubble valuations in the future). For most people, they would be better off paying down their mortgage (a guaranteed return) as opposed to passively investing in index funds (which carry risk, particularly when at high valuations). However, our job is not to invest in the broad market, but to identify individual stocks where the risk-reward ratio is more compelling. As we have reiterated many times, all that matters is what you own. The market could be overvalued, yet you can still do extremely well being fully invested if you pick out good deals. For example, in the year 2000, during the biggest bubble of our lifetime, there was a dichotomy between overvalued tech/internet/large-cap stocks and undervalued small-cap stocks.
In conclusion, what we glean from all of this analysis is that when we are researching individual stocks, we need to be careful to normalize earnings to prevent the mistake of extrapolating earnings from unsustainable peak profit margins.
Concluding Remarks
During one of the most volatile periods ever for stocks, we want to point out that the earnings of the underlying businesses within your portfolios remained steady. Thus, despite the decline in stock market prices, we believe the intrinsic values of your holdings remain unchanged or have continued to grow. We believe your portfolios are well-positioned to withstand the uncertainties that loom ahead.
Thank you for your continued trust and loyalty.
Sincerely,
The YCG Team
Disclaimer: The specific securities identified and discussed should not be considered a recommendation to purchase or sell any particular security nor were they selected based on profitability. Rather, this commentary is presented solely for the purpose of illustrating YCG’s investment approach. These commentaries contain our views and opinions at the time such commentaries were written and are subject to change thereafter. The securities discussed do not necessarily reflect current recommendations nor do they represent an account’s entire portfolio and in the aggregate may represent only a small percentage of an account’s portfolio holdings. A complete list of all securities recommended for the immediately preceding year is available upon request. These commentaries may include “forward looking statements” which may or may not be accurate in the long-term. It should not be assumed that any of the securities transactions or holdings discussed were or will prove to be profitable. S&P stands for Standard & Poor’s. All S&P data is provided “as is.” In no event, shall S&P, its affiliates or any S&P data provider have any liability of any kind in connection with the S&P data. MSCI stands for Morgan Stanley Capital International. All MSCI data is provided “as is.” In no event, shall MSCI, its affiliates or any MSCI data provider have any liability of any kind in connection with the MSCI data. Past performance is no guarantee of future results.