
2011 saw political revolts in Egypt and the Middle East, a tsunami in Japan, commodity prices spiking, housing prices double-dipping, stubbornly high unemployment, a Greece bail-out, a U.S. debt downgrade, an ongoing sovereign debt crisis in Europe, and signs of slowing in China. After such a rollercoaster year, we were surprised to notice the S&P 500 closed within pennies of where it began a year ago (Closed at $1,257.60 versus $1,257.64 one year ago) – returning 2.11% when you add in dividends. It should be noted that many foreign markets reflected what most investors probably felt, with many of them (Germany, France, Brazil, Japan, China) down double digits over the course of the year. As many say, “volatility is your friend,” and in this environment, we are extremely pleased to report that the average return across our strategies was 8.59% for the year – a return which beat four of the five managers nominated by Morningstar for “Domestic-Stock Fund Manager of the Year for 2011” award.
However, we do not like to judge performance on such a short-term basis. When we reflect upon our 3-year numbers, we are happy to find that according to Morningstar’s database, our Concentrated Composite with Option Enhancement performance lands us in the top 5% for managers across all market-caps. Through most of that period, our composite was heavily tilted towards large value stocks, so we narrowed the search to compare ourselves to managers within that category and found our performance was in the top 1%. Since the inception of our Concentrated Composite with Option Enhancement composite three and a half years ago, the S&P 500 has returned a measly annualized 1.75% versus our double digit annualized return of 11.40%. Given that this performance occurred during one of the rockiest markets in financial history, needless to say, we are thrilled.
Correlation
Each day the market is open, we have software that beautifully displays a list of ticker symbols and provides their real-time price quotes and percentage changes from the prior day – if a stock is down, the numbers are shown in red (my brother Steve refers to these as “Tomorrow’s Heroes”), if a stock is up, the numbers are shown in green (he refers to these as “Yesterday’s Losers”). For much of the year, it seemed on any given day we would either see everything on our list in green, or a sea of red, but no mixture of the two.
This correlation between stocks is often measured using the CBOE S&P 500 Implied Correlation Index which uses options prices to measure the correlation between the 50 largest stocks within the S&P 500. A reading of 100 would imply stocks are moving in lockstep, whereas a reading of zero would imply no relationship. During the panic at the end of 2008 and beginning of 2009, readings actually surpassed 100, compared to the typical 40 to 60 range seen during “normal” periods when stocks’ price movement behavior is based more upon the individual merits of a company. Most of last year this measurement remained elevated north of 60, and sometimes spiked above 90, and stands near 80 today. There was this macroeconomic or systemic feeling permeating the industry on the belief that “everything hinges on Europe,” and with the fear that “everything gets wet in a hurricane.”
In a type of environment where all stocks seem to move in concert, most would assume “stock pickers” would have a difficult time proving their worth. However, over time, the stream of cash flows a business distributes will eventually determine the value of a stock. As this unified behavior continues, it reminds me of an analogy my Father loves to use. He says to imagine depressed stock prices as beach balls being pushed underwater. The water level is the intrinsic value of the business. If the water level is rising, then the pressure is building on the stock price. Eventually, the hands will release and the stock will pop to the surface. So, if we have done our job correctly, the stock prices of the businesses we own will eventually separate themselves from other businesses and “swim against this correlation tide.”
Is Corning’s Glass Half-Empty?
It is almost hard to believe that shares of Corning (GLW) have fallen to almost one-tenth of the price they fetched a decade ago, especially considering that since that time the glass company has almost doubled their earnings. Corning is one of the former darlings from the tech bubble that has suffered severe multiple compression over the past decade. Yet, as the pricing pendulum had swung too high in the past, it may have now dipped too low to ignore.
Corning’s revenues suggest a company with a wide diversity of segments including optical fiber for telecommunications, Pyrex glassware, automotive exhaust filters, and many others. However, their net profits suggest a different story. Nearly 84% of their profits stem from the sale of display glass that is found in TVs, PCs, tablets, and smartphones. This dependence on LCD screen sales has created uncertainty over their future earnings stream as the economy slows and forecasts of future sales have been reduced. Still, there is hope as the demand for high-end phones and tablet computers continues to grow at a rapid pace, driving the overall demand for products such as Corning’s Gorilla Glass.
Regardless, Corning’s price had dropped too low to ignore and we initiated a tiny position when it was trading at approximately 4 times operating income, so earnings could drop in half and the stock would still remain attractively priced. In fact, Corning currently trades below book value.
In addition to an attractive price, Corning also has a very strong net cash position on their balance sheet, as well as on the balance sheet of their subsidiary Samsung-Corning (of which they own 50%). Even if they face tough times, Corning will likely avoid shattering to pieces as it is well positioned to weather the storm.
Clearly management sees the value in their company’s shares at the current price. Recently, they authorized an ambitious $1.5 billion stock repurchase program. Also, CFO James Flaws and board member John A. Canning Jr. have been scooping up shares for themselves as well. They have shown additional confidence in their long-term prospects by recently boosting the dividend by 50% from 20 cents to 30 cents, bringing the overall dividend yield over 2%. Shareholders do not need to wait around to start receiving cash as they will be doubly rewarded through the combination of share buybacks and higher dividends. Therefore, we view Corning’s glass as half full.
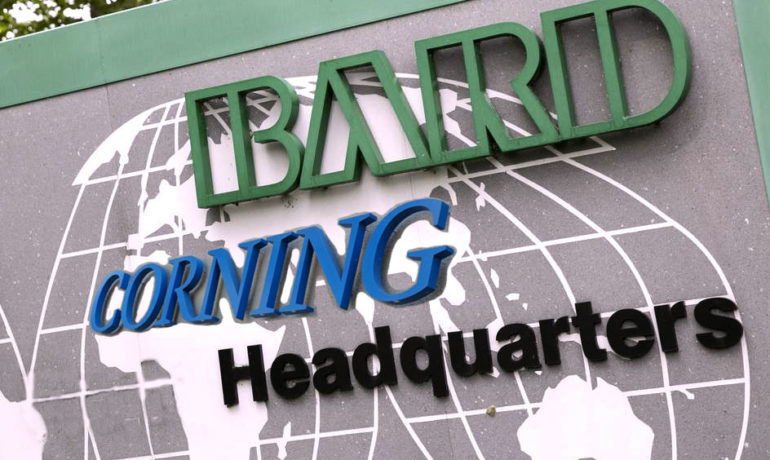
A Bard’s Tale
Earlier this year, we decided to take a position in Abbott (ABT). Recently, we have decided to move out of our investment in Abbott and rotate into something we are currently finding more attractive – CR Bard (BCR).
The company’s name may not be a common household term, but it certainly produces products that are used every day. Bard is best known for producing catheters. They also produce a variety of other disposable medical products through their four core divisions: Urology, Oncology, Vascular, and Surgical Specialties.
Their major source of profits stems from catheters, most of which are sold through its Urology division (26% of revenues) and also specialized access versions through its Oncology division (27% of revenues). Bard also has diversified products in its Vascular division (28% of revenues) such as stents, grafts, angioplasty, etc. and its Surgical Specialties division (16% of revenues).
The management team at Bard has also proven to be adept at increasing shareholder value over the years. Not only have they done a decent job generating double-digit returns on invested capital, but they have also worked hard to return cash flow to shareholders. Although the dividend is not anything to shout about, Bard’s management has aggressively bought back shares when prices were attractive to increase intrinsic shareholder value, paying out nearly all of their free cash flow.
Overall, an investment in CR Bard means getting a high quality company that sells disposable medical products in addition to a competent management that is dedicated to raising shareholder value. At its current valuation, we believe Bard is a very attractive investment.
Concluding Remarks
This year marks the year our oldest daughters both discovered the truth about Santa Claus. We wonder if this upcoming year may prove to be the year investors discover the truth about a “Santa Claus” figure coming to solve global debt troubles. We take seriously our fiduciary responsibility to protect your hard earned money. As of now, investors have what we believe to be misplaced faith that these problems will miraculously disappear. We anticipate more of the same – lots of “friendly” volatility to come – and will stand ever vigilant to capitalize on the opportunities that this volatility presents, while simultaneously seeking investments that will prevent permanent losses of capital.
We thank you for your continued trust and loyalty. Wishing you a happy, healthy, and prosperous 2012!
Sincerely,
The YCG Team
Disclaimer: The specific securities identified and discussed should not be considered a recommendation to purchase or sell any particular security nor were they selected based on profitability. Rather, this commentary is presented solely for the purpose of illustrating YCG’s investment approach. These commentaries contain our views and opinions at the time such commentaries were written and are subject to change thereafter. The securities discussed do not necessarily reflect current recommendations nor do they represent an account’s entire portfolio and in the aggregate may represent only a small percentage of an account’s portfolio holdings. A complete list of all securities recommended for the immediately preceding year is available upon request. These commentaries may include “forward looking statements” which may or may not be accurate in the long-term. It should not be assumed that any of the securities transactions or holdings discussed were or will prove to be profitable. S&P stands for Standard & Poor’s. All S&P data is provided “as is.” In no event, shall S&P, its affiliates or any S&P data provider have any liability of any kind in connection with the S&P data. MSCI stands for Morgan Stanley Capital International. All MSCI data is provided “as is.” In no event, shall MSCI, its affiliates or any MSCI data provider have any liability of any kind in connection with the MSCI data. Past performance is no guarantee of future results.