
Yet another historical year! Alan Abelson summed up 2009 nicely: “An economy on crutches accompanied by a stock market on steroids.” (Barron’s, December 28th issue). We are glad to report that for the year 2009 our investment strategies appreciated 34.3 to 49.8 percent, compared to the S&P 500’s 26.5 percent. We are even more pleased with the combination of providing solid downside protection in 2008, enabling us to participate and outperform in the rally of 2009.
Is the market declaring victory a little too early? Many of the concerns that have been shared in our previous letters are still present today, namely, an overleveraged economy, rising unemployment, more housing defaults coming, and long-term inflationary pressure. Is it possible we are experiencing a self-fulfilling prophecy where everybody thinks the recession is ending, and so it is…at least for now? Less bad news is no longer good enough; as the fictional character Jerry Maguire said: “Show me the money!”
From the March lows, the S&P 500 has gained 68%, although it remains 25% below its all time high. It might seem reasonable and even stimulating to envision the S&P 500 returning to $1,565 where it sat in October 2007. However, some words of caution – keep three things in mind. First, operating margins were at an all time high, about 40 percent above average. Second, the price to earnings multiple on the overall market was above historic norms, which again, were being multiplied on inflated earnings. Finally, many of the losses that have taken place in the financial sector were permanent losses of capital. If you were to account for those losses, the S&P 500 high of $1,565 equates to a level of about $1,325 today! We still assert the fair value to be approximately between $900 and $1,000, compared to $1,115 where it stands today. We would not count on it returning to its all time high anytime soon.
Forecasting
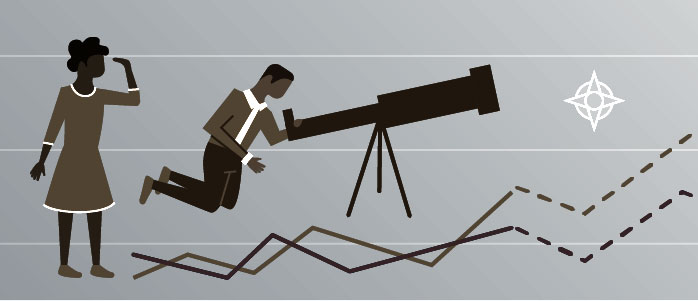
With this being a year-end letter, we imagine you may be wondering what our forecast is for 2010. Making and hearing predictions about the future seems to be a constant desire, an exciting and addicting task – just ask Las Vegas. This seems particularly true amongst Wall Street participants – just turn on CNBC. Every November, Barron’s interviews major Wall Street firms and then publishes an outlook for the upcoming year. We thought it might be amusing to reflect back and see how these experts have done. Of particular interest to us was to see how they fared in predicting the 2008 market collapse, followed by the 2009 market rally. Here are their predictions:
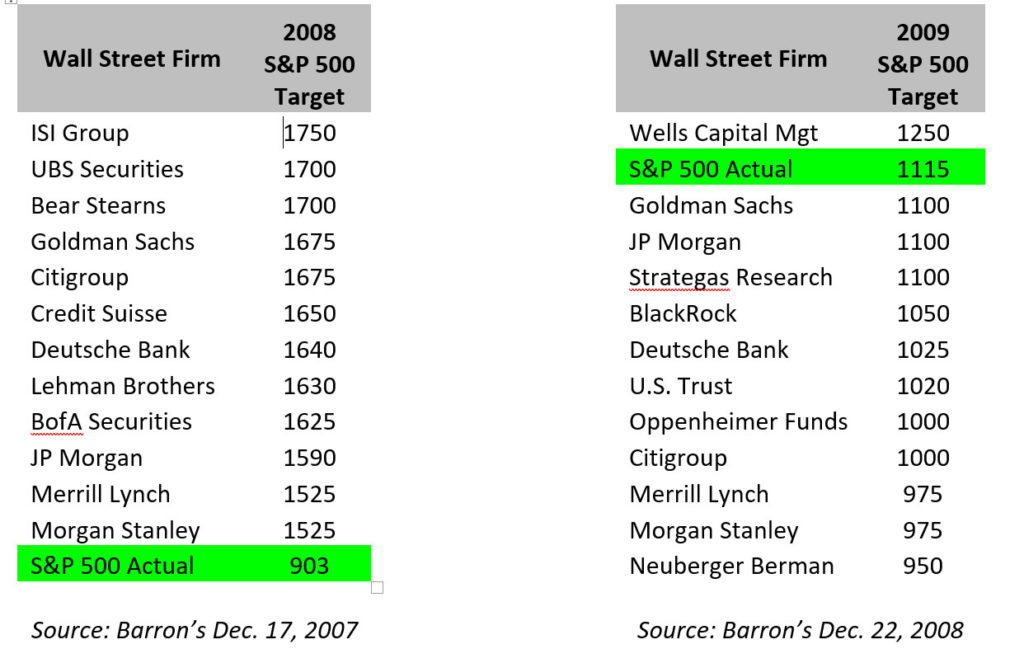
The December 17, 2007 Barron’s article which published the 2008 predictions was headlined “Wall Street’s seers forecast more gains for stocks next year…” Note, when the 2008 forecasts were made, the S&P 500 traded at $1,481, meaning every single 2008 forecast predicted an up year! Predictions ranged from 3-18 percent, when in actuality it was negative 37 percent! As we pointed out last quarter, even the Fed forecasted positive growth for 2008. To their credit, all the analysts predicted an up year in 2009 in what became an exceptional rally. But even in that case, only 25 percent of the forecasts were close to actuality.
We are not trying to be harsh – we do not envy the difficult and near impossible job of a forecaster – but this might explain why we did not even take the time to compile the 2010 outlook. Successful investing does not require being able to accurately predict the future direction of the market, but rather identifying businesses trading below their intrinsic value.
Unemployment – the Lagging indicator
When it comes to inaccurate forecasts, the Fed and Wall Street analysts have some company. Earlier this year, the current administration predicted the unemployment rate would peak at 8 percent before beginning to fall toward the end of 2009. In actuality, the nation’s unemployment rate hit 10.2 percent in October for the first time since 1983, and only the second time since official recordkeeping began in 1948.
Not intending any claim to fame, we believed the writing was on the wall. In our December 5th, 2008 blog, we wrote: “The jobs report is in, and unemployment doesn’t look so good coming in at 6.7%. But we need to realize that this is actually about in line with historic norms of an unemployment rate around 7%. The current unemployment rate would need to double to reach the 81-82 recession levels, and is still nothing compared to the 25% levels seen during the Great Depression. We wouldn’t be surprised to see this number continue to hike up. “Experts” see this number reaching 9% by the end of 2009, we wouldn’t be surprised to see this number enter double digit territory by then. Yet another reason to continue to invest in businesses that make products people will continue to consume…even without a job.”
This brings the official count of job losses since the recession began in December 2007 to about 8 million. Unfortunately, all these statistics do not accurately reflect what is really happening underneath.
First, the jobless rate can be misleading because there is downward pressure on this statistic from discouraged workers dropping out of the labor force altogether. For example, even though job losses increased through year end, the unemployment rate dropped slightly to 10 percent by virtue of workers dropping out of the labor force. When you do include these workers, as well as those who are called “marginally attached workers” (meaning those who “would like” and are able to work, but have not looked for work recently), and those involuntary part-timers who wish they had a full time position with benefits, this number bloats from 10 percent to 17.3 percent. We find it ironic that headlines highlight that claims are now rising less than expected, while overlooking the fact that we are at historically high levels.
History suggests employment levels are traditionally a lagging indicator. This is because employers tend to avoid shedding workers until after they have been hit by a downturn, and they are unwilling to hire until they are overwhelmingly convinced the recession is over. Frequently, unemployment will actually worsen even while the economy is on the upswing. Even when companies are confident economic conditions are improving, they are reluctant to hire and instead focus first on tapping their current, under-utilized employees who are working part time against their will.
However, this time things are very different and we strongly believe unemployment will act as a leading indicator. In the past, when the consumer was in limbo searching for a new job, they could either use their saved up rainy day funds or borrow against their home or on a credit card to maintain their spending. But this time a good portion of homes have negative equity, and in general, consumers are laden in more debt than we have ever seen – thus little credit available. Second, for many of those who have saved, uncertainty has led to fear about the security of their future employment and consequently more frugality. With this combination of either the inability to borrow and/or the cautious, more frugal consumer, it seems to make sense that the revenue lines of businesses will not be able to increase until employment picks up again.
No government magic job wand will fix this workforce problem anytime soon. Bear in mind, when this historic borrowing binge ended, millions of jobs were lost in the financial and construction industries – jobs which likely will not return for years to come. With these swelling unemployment numbers, we cannot help but think analysts have overly rosy earnings expectations. We believe the media, and analysts, need to stop dismissing unemployment as a “lagging” indicator and give respect to this vicious consumer deleveraging process.
Concluding Remarks
In the fourth quarter we continued to shift into many of the quality businesses we mentioned in our last letter, as they have continued to lag the market, and even built some cash. True, unemployment might abate and the economy could prove resilient, but we would rather leave some money on the table than be greedy. As the old adage on Wall Street goes, “Be a bull, be a bear, but don’t be a pig.”
Despite the difficulty of predicting the future, you can still get things generally right by taking into consideration some of these obvious concerns such as leverage and unemployment. Armed with this understanding, we can prepare for whatever may lie ahead. Whether what we believe about the near term is accurate or not, we are confident the answer is to hold strong to our strategy of finding above average businesses at below average prices. We remain very optimistic about the future prospects for your portfolios.
We want to thank you for your trust. We want you to know that we take seriously our fiduciary responsibility to protect your hard earned money. We will strive to continue to provide strong, risk adjusted returns. Wishing you a happy, healthy, and prosperous 2010!
Sincerely,
The YCG Team
Disclaimer: The specific securities identified and discussed should not be considered a recommendation to purchase or sell any particular security nor were they selected based on profitability. Rather, this commentary is presented solely for the purpose of illustrating YCG’s investment approach. These commentaries contain our views and opinions at the time such commentaries were written and are subject to change thereafter. The securities discussed do not necessarily reflect current recommendations nor do they represent an account’s entire portfolio and in the aggregate may represent only a small percentage of an account’s portfolio holdings. A complete list of all securities recommended for the immediately preceding year is available upon request. These commentaries may include “forward looking statements” which may or may not be accurate in the long-term. It should not be assumed that any of the securities transactions or holdings discussed were or will prove to be profitable. S&P stands for Standard & Poor’s. All S&P data is provided “as is.” In no event, shall S&P, its affiliates or any S&P data provider have any liability of any kind in connection with the S&P data. MSCI stands for Morgan Stanley Capital International. All MSCI data is provided “as is.” In no event, shall MSCI, its affiliates or any MSCI data provider have any liability of any kind in connection with the MSCI data. Past performance is no guarantee of future results.