


The S&P 500 Index returned 9.07% and the S&P Global Broad Market Index returned 9.14% in the quarter ended December 31, 2019.[1]
As of this writing, the decade of the 2010s is history. And what a decade it was for stock market investors! During the 2010s, the S&P 500 generated an exceptional 13.56% per year return. Even more impressive, the risk required to achieve this return was, according to one important Wall-Street metric, lower than in any decade since the 1950s.[2] What’s even more amazing about these results is that they were achieved despite a litany of legitimate economic worries along the way. Below we’ve outlined some of the major ones of the decade.
- Extend and Pretend: Were government and bank actions in response to the Global Financial Crisis just papering over large problems that would eventually come home to roost?
- Sovereign debt crises of Greece, Spain, and Italy: Would these lead to a break-up of the Eurozone, banks failing, and a European depression?
- Terrorism: Could more attacks occur and cause massive slowdowns in global travel, leisure, and general economic activity?
- Commodity Bust: Would the slow-down in the emerging markets that caused falling commodity prices also cause an industrial recession?
- China housing bubble and potential crash: Would a crash cause a financial panic in China and a global economic slowdown similar to what happened in 2008 with the United States and many other parts of the developed world?
- Inflation then deflation then inflation then deflation: Would inflation lead to higher interest rates that would pressure earnings multiples, or would deflation lead to negative rates that would pressure bank lending spreads and profitability, leading to prolonged, slow economic activity and potentially a deflationary spiral?
- Brexit: Would this event lead to a break-up of the Eurozone, banks failing, and a European depression?
- Political polarity leading to the rise of more extreme populist and/or autocratic leaders: Would this trend increase the probability of war (trade, armed, and/or capital) among countries? Would it reverse globalization? Would it cause much higher taxes and wealth redistribution?
- Rising government debt as a percentage of GDP in many countries around the world, including the United States: Would this trend eventually lead to rising interest rates, causing an economic slowdown and/or pressuring earnings multiples?
- Generalized fear about a repeat of the Great Financial Crisis, possibly worse this time around.
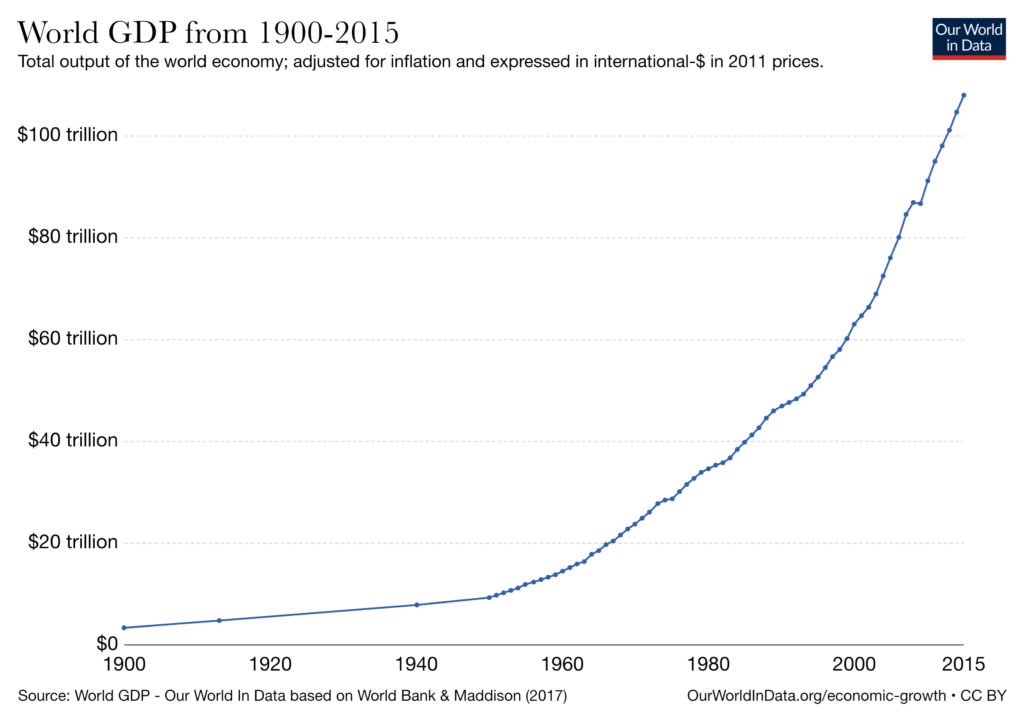
Yet despite all these legitimate fears, many of which came at least partially to fruition, both the S&P 500 Index and the S&P Global Broad Market Index powered through. What explains this market resilience and growth? In our view, the main explanation is that investors almost always underestimate humanity’s ability, through innovation and cooperation, to solve its problems and grow its economic activity and wealth over time. Since 1900, despite multiple world wars, depressions, energy shocks, and other geopolitical and economic crises, world GDP has risen from roughly $3 trillion to well over $100 trillion.[3]
And we believe this growth is likely to continue, if not speed up, over the next 120 years. Though many do not realize it, six of the seven billion people in the world still live on less than 32 dollars a day.[1] Until recently, many of these people lived and worked in communities with limited exposure to the idea-sharing and innovation that have powered growth in the rest of the world. But now, with the spread of the internet and mobile phones, sixty percent of the world’s population (4.5 billion people) are connected both to each other and to the cumulative knowledge of civilization.[2] And that number is rising ever year. Before long, almost everyone will be connected. So, we would pose this question to all those who are negative on the future of the world: If a one-billion-person innovation network could create all that’s around us, what will a seven-billion-person innovation network be able to accomplish?
However, while we’re confident that global economic activity and wealth will rise over time, we’re even more confident that the world’s growth path won’t always be smooth. There will be periods of stagnation, recession, and even depression. The problem is, neither we nor anyone else, for that matter, can predict when these bumps in the road will occur. Therefore, we think the best way to proceed as investors is to own a collection of assets that can benefit from what we believe we can predict (long-term global wealth growth) while also protecting us from what we can’t (the inevitable but unpredictable bumps in the road).
At YCG, we think the assets that best fit this description are equity ownership interests of global champions with enduring pricing power and long-term volume opportunities. In our view, the combination of enduring pricing power (a rare quality in a world where technological innovation brings down prices on almost all goods and services) and global scale gives these businesses, and thus their shareholders, the best chance of participating in global wealth growth. Of equal importance, we believe this combination gives shareholders tremendous protection against the economic bumps in the road. Because the global champions with pricing power that we own are generally the strongest and most conservatively capitalized businesses in their respective industries, we believe they are also the most likely to be able to survive economic downturns. In fact, many of them actually use downturns to strengthen their market positioning by continuing to grow while others are shrinking or, in some cases, by buying distressed competitors. Moreover, because investors tend to prefer their relative safety during downturns, their stock prices tend to hold up better than their competitors, making it easier for us to act from a position of strength during difficult times as well.
Concluding Thoughts
As we’ve written before, we believe there are two keys to a sound investment strategy. The strategy must 1) work (i.e. achieve its investment objective if executed correctly) and 2) be simple and robust enough that it can be confidently and correctly executed in both good times and bad. We believe our strategy at YCG meets both criteria. By owning a diverse collection of global champions with enduring pricing power and long-term volume growth opportunities, we believe we’ve positioned ourselves both to participate in the growth of global wealth and to confidently traverse the emotional and financial potholes that the economy and financial markets will put in our way from time to time.
As always, thank you for your continued trust, know that we’re invested alongside you, and please let us know if there is anything you need. We are here to help.
Sincerely,
The YCG Team
Disclaimer: The specific securities identified and discussed should not be considered a recommendation to purchase or sell any particular security nor were they selected based on profitability. Rather, this commentary is presented solely for the purpose of illustrating YCG’s investment approach. These commentaries contain our views and opinions at the time such commentaries were written and are subject to change thereafter. The securities discussed do not necessarily reflect current recommendations nor do they represent an account’s entire portfolio and, in the aggregate, may represent only a small percentage of an account’s portfolio holdings. A complete list of all securities recommended for the immediately preceding year is available upon request. These commentaries may include “forward looking statements” which may or may not be accurate in the long-term. It should not be assumed that any of the securities transactions or holdings discussed were or will prove to be profitable. S&P stands for Standard & Poor’s. All S&P data is provided “as is.” In no event, shall S&P, its affiliates or any S&P data provider have any liability of any kind in connection with the S&P data. MSCI stands for Morgan Stanley Capital International. All MSCI data is provided “as is.” In no event, shall MSCI, its affiliates or any MSCI data provider have any liability of any kind in connection with the MSCI data. Past performance is no guarantee of future results.
[1] For information on the performance of our separate account composite strategies, please visit www.ycginvestments.com/performance. For information about your specific account performance, please contact us at (512) 505-2347 or email [email protected]. All returns are in USD unless otherwise stated.
[2] During the 2010s, the S&P 500’s Sharpe ratio, a measurement that tracks stock market performance relative to Treasuries and stock market volatility, was higher than in any decade since the 1950s. See https://www.bloomberg.com/news/articles/2019-12-15/the-bull-market-almost-no-one-saw-coming for more details.
[3] See https://ourworldindata.org/economic-growth#the-world-economy-over-the-last-two-millennia.
[4] See https://earthbound.report/2018/11/14/the-four-levels-of-global-income/ and https://www.gapminder.org/tools/#$chart-type=mountain. As the gapminder.org link shows, the 2019 estimated ratio of people living on less than 32 dollars a day is 6.6 billion out of a total world population of 7.7 billion.
[5] See https://www.bankmycell.com/blog/how-many-phones-are-in-the-world and https://www.internetworldstats.com/stats.htm.