

The S&P 500 Index returned 8.74% and the S&P Global Broad Market Index returned 6.01% in the quarter ended June 30, 2023.1
During the first half of this year, most of our tech stocks dramatically outperformed the rest of the market. They also outperformed leading waste management, railroad, and financial exchange businesses that we’ve come to believe have more pricing power, less cyclicality, and more certain long-term prospects than some of our tech businesses. As a result, we sold the technology businesses about which we were less certain (Meta Platforms Inc., Booking Holdings Inc.), trimmed our exposure to a few more that had become oversized, and bought these new stocks instead.
Additionally, we grew increasingly concerned about our small positions in Chinese tech stocks Tencent Holdings Ltd and Alibaba Group. We believe we underestimated both the risk of competitive disruption and the risk of our equity interest in these businesses eventually getting diluted or invalidated by economic warfare between the U.S. and China. Therefore, we sold our interests in these two businesses and used some of the proceeds to buy more of the new businesses mentioned above and some to increase our position in Estee Lauder, a business that’s experienced recent share price weakness and is also China-exposed but that, in our opinion, has much lower competitive disruption and equity dilution risk.
Lastly, we believe the new businesses we’ve added are more consistent with our strategy than the bank stocks we’ve historically owned while serving as better hedges in a scenario of inflation and deglobalization. Thus, we mostly exited our banking investments and replaced them with these new businesses.
In the remainder of this letter, we’ll explain why we find the long-term prospects of Waste Management Inc., Republic Services Inc., Canadian Pacific Kansas City Limited, Canadian National Railways Co., and CME Group Inc. to be so attractive. Then, we’ll discuss in more detail why we believe the waste management companies and railroads are better hedges for inflation and deglobalization than the banks.
Waste Management and Republic Services
Waste Management is the largest waste management company in North America with 29% market share of landfill volume in the United States. Republic Services is the second largest with 19% share of U.S. landfill volume.2 Both maintain extensive operations in Canada as well, but the revenue contribution is much smaller at less than 5% for Waste Management and, though it’s undisclosed, likely a similar percentage for Republic Services. Waste Management benefits from physical network effects as a result of its nearly unrivaled network of 254 landfills, 337 transfer facilities, 135 landfill gas to energy facilities, 97 materials recovery facilities, 497 hauling operations, and 15,200 collection routes.3 Republic Services also benefits from physical network effects as a result of its extensive network of 206 landfills, 240 transfer stations, 73 landfill gas and renewable energy projects, 72 recycling centers, 356 collection operations, and 5 million average daily pickups that is second only to Waste Management’s in size and scope.4 The waste management companies also benefit from a not-in-my-backyard (“NIMBY”) dynamic that makes it extremely difficult for new supply of landfills and other waste management facilities to enter the market. In fact, because of NIMBY and industry consolidation, the number of U.S. landfills has fallen from 7,683 in 1986 to 1,733 today.5 When combined with steadily rising demand for waste management, this supply-side rationalization has resulted in tipping fees, or the price landfills charge trucks to drop off trash, rising over time. In fact, from 1982 to 2021, U.S. municipal solid waste landfill tipping fees increased from $8.07 per ton to $58.2 per ton,6 a compound annual growth rate of 5.2% per year compared to inflation’s compound annual growth rate of only 2.7% per year. Going forward, with waste management demand projected to continue increasing over time,7 NIMBY and regulatory costs continuing to rise, and the network value of the largest industry participants continuing to increase more quickly than smaller competitors through consolidation and market share gains, we believe industry leaders Waste Management and Republic Services will continue to grow their pricing, revenue, and profits faster than inflation for years to come.
In summary, we think Waste Management and Republic Services are dominant networks with enduring pricing power that essentially serve as toll collectors on U.S. and Canadian consumption, thereby making them a great way to participate in the long-term growth of North America.
Canadian Pacific Kansas City Limited and Canadian National Railway
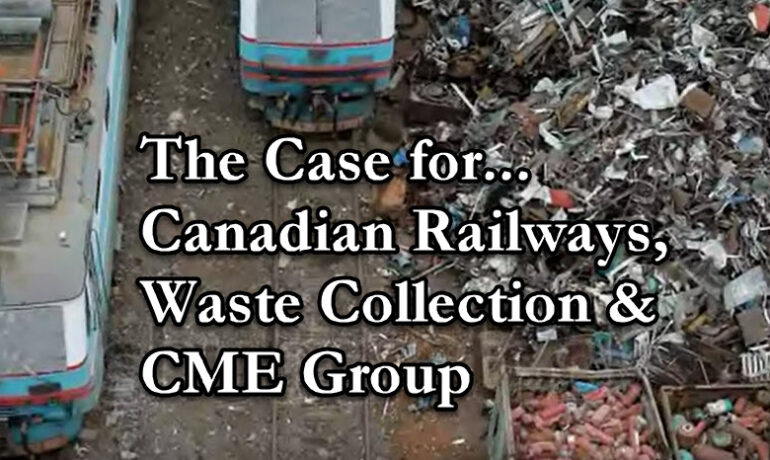
Canadian Pacific Kansas City Limited and Canadian National Railway are two of six class 1 railroads in North America, each of which is essentially one half of a duopoly with two railroads serving the eastern United States, two railroads serving the western United States, and two railroads serving Canada by extending coast-to-coast and then down in a T-shape through the middle of the United States down to the Gulf of Mexico and, in the case of Canadian Pacific Kansas City Limited, down into Mexico as well.
Canadian Pacific Kansas City Limited benefits from physical network effects because of its virtually unrivaled 20,000-mile rail network connecting Canada, the United States, and Mexico.8
Source: Slide 5 of Q1 2023 Earnings Review.
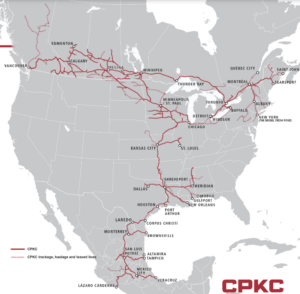
Canadian National Railway benefits from physical network effects as a result of its virtually unrivaled 18,600-mile rail network connecting Canada and the United States.9
Source: Slide 3 of “Sell the Plan” May 3, 2023, Investor Day Presentation.
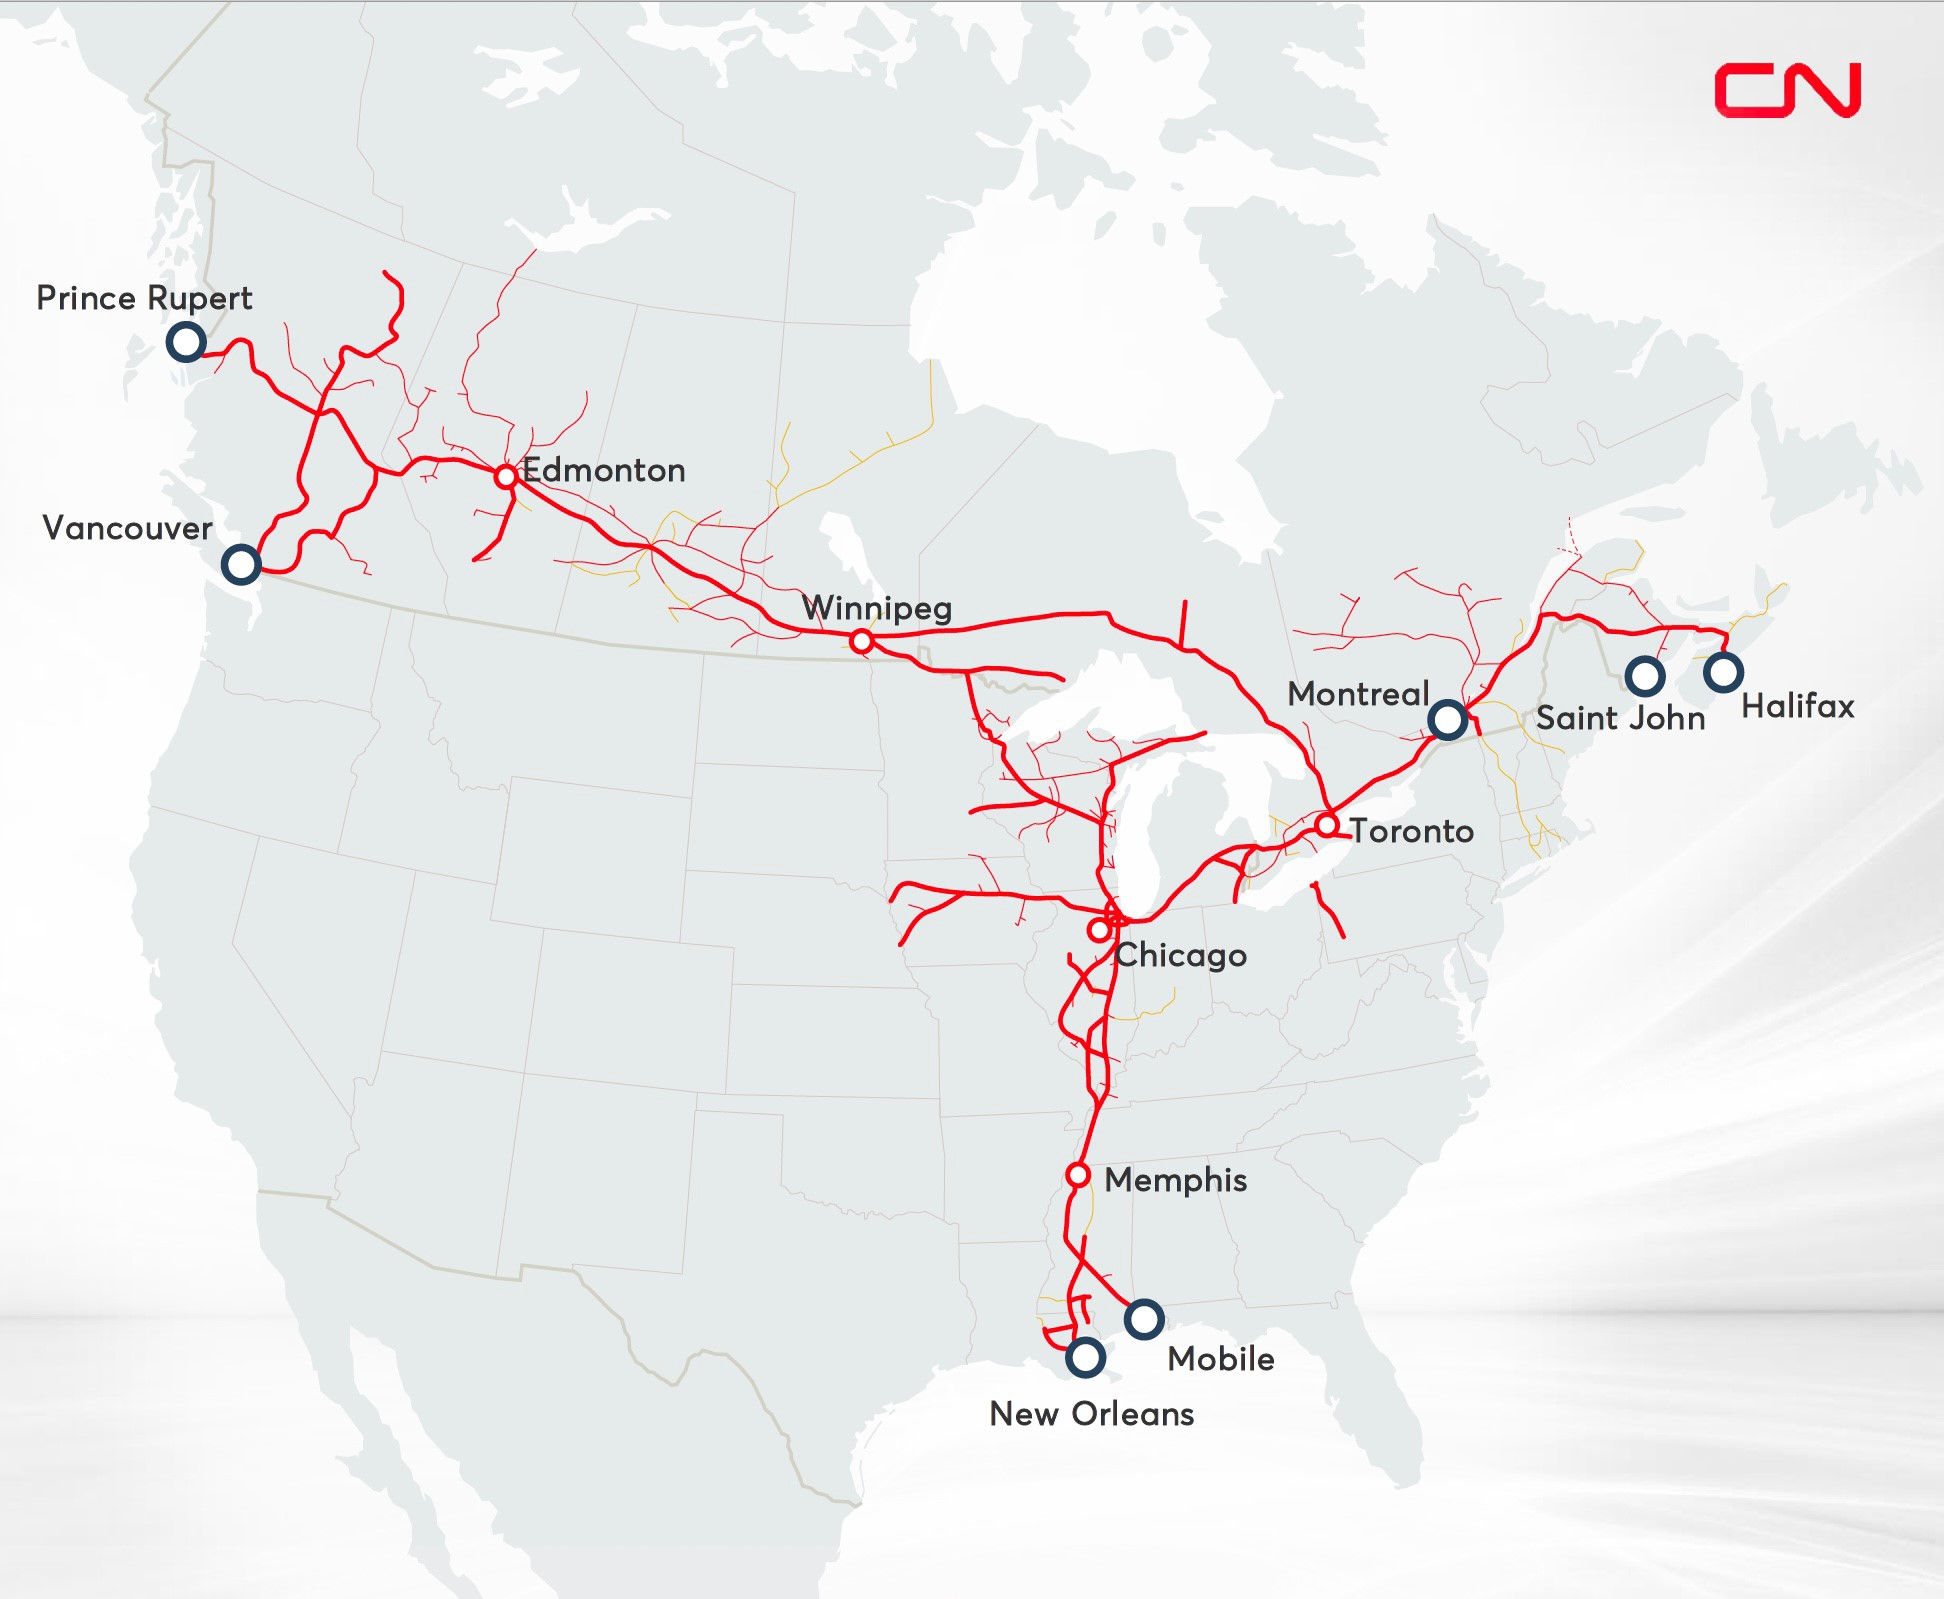
The railroads also benefit from a not-in-my-backyard (“NIMBY”) dynamic that makes it almost impossible to construct a new, competing railroad. In fact, because of NIMBY, transportation deregulation that accelerated following the Stagger’s Act of 1980, and industry consolidation, the number of North American railroad miles has fallen from a peak of 250,000 in the early 1900s to less than 100,000 today and the number of North American class 1 railroads has plummeted from over 180 to just 6 today.10
![]()
Source: Rodrigue, J-P (ed) (2020), The Geography of Transport Systems, Fifth Edition, New York: Routledge.
When combined with steadily rising freight demand, this supply-side rationalization has dramatically changed the pricing dynamic in the railroad industry. In the early 2000s, long-term, inflation-adjusted pricing trends inflected from consistent declines to a now almost 20-year period of consistent increases.11
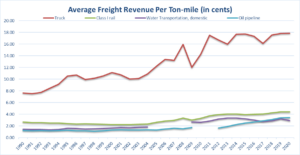
And given the continued projected growth in freight demand,12 the now oligopolistic structure of the railroad industry, and the much lower pricing railroads can profitably offer (see first chart13 below) as a result of their massive energy and labor efficiency relative to trucking, making them especially dominant on long-haul routes (see second chart14 below), we believe the six North American class 1 railroads will continue to grow their pricing, revenue, and profits faster than inflation for years to come.
Source: Bureau of Transportation Statistics.
![]()
While we believe all the North American class 1 railroads are attractive long-term investments, we’ve chosen to invest in the Canadian rails because we believe they can grow faster and have less regulatory risk than the U.S. rails. We believe they can grow faster than U.S. rails because their volume growth benefits from less exposure to secularly declining coal as well as a long-term trend of Canadian ports taking share from U.S. ports because of greater government investment.15 Furthermore, we believe they have less regulatory risk than U.S. rails because Canadians have historically been more comfortable than Americans with oligopolistic industry structures, as can be seen most clearly by differences in their banking system approval ratings. Canadians overwhelming approve of their oligopolistic banking system,16 in which the top five banks have over 85% market share,17 whereas Americans distrust their banking system and, in particular, the big banks,18 despite the fact that the top five banks in the United States have only 25% market share.19
In summary, we think the Canadian rails are dominant networks with enduring pricing power that essentially serve as toll collectors on both North American and global industrial production, thereby making them a great way to participate in the long-term growth of these important categories.
CME Group
CME Group owns the Chicago Mercantile Exchange, the Chicago Board of Trade, the New York Mercantile Exchange, and the Commodity Exchange, making it the world’s leading futures and options exchange operator. Its three largest futures and options categories are 1) interest rates, where it possesses 95% market share in U.S. interest rate futures trading;20 2) equity indexes, where, largely because of its 27% ownership stake in S&P Dow Jones Indices,21 it has exclusive licenses to issue futures contracts on the S&P 500, Russell 2000, and Nasdaq indexes; and 3) energy, where it has a dominant position in WTI oil futures trading. The company benefits from two network effects. The first occurs at the exchanges themselves, which are global, two-sided networks that connect buyers and sellers of futures and options contracts and provide them with unrivaled liquidity. This two-sided network effect is further strengthened by the nature of the futures contracts traded on the exchanges. For most assets, traders have no restrictions on where they can buy and sell them. For instance, if a trader buys Microsoft stock on the NASDAQ, he or she can subsequently sell it on any number of exchanges or on increasingly popular alternative trading systems (ATS) such as dark pools and electronic communication networks (ECN). In fact, ATS platforms have become so popular that, as of April 2019, traders chose to execute nearly 39% of all their U.S. stock trades on them.22 Futures contracts are different. Futures contracts opened on one exchange cannot be closed at another exchange, making it much harder for competitors to successfully develop alternative sources of liquidity for futures buyers and sellers.
CME Group also owns the clearinghouse that validates and finalizes all the futures transactions that occur on its exchange, further enhancing its competitive position through a second, overlapping network effect. Clearinghouses, which serve as third-party intermediaries to ensure that both buyers and sellers honor their contractual obligations, benefit from network effects due to something called position netting. Position netting occurs when a customer places two or more trades through the same clearinghouse and these trades either fully or partially offset each other. When this situation occurs, the clearinghouse requires the customer to put up only enough money to cover the net position, which allows the customer to earn the same dollar return on its trades but with less capital invested than if the positions weren’t netted, raising the customer’s return on investment. For example, if a trader bought $100 worth of Microsoft stock that posted at one clearinghouse and sold $90 short that posted at another clearinghouse and each clearinghouse required the trader to post an amount equal to 100% of the capital at risk, then he or she would have to post $190. However, if the trader bought $100 of Microsoft and sold short $90 dollars of Microsoft through the same clearinghouse, he or she would only be required to post $10 dollars as collateral. As you can see, this netting effect creates a huge incentive for customers to use as few clearinghouses as possible. Importantly, the fact that CME Group owns both the exchanges and their clearinghouse is a huge advantage that is relatively uncommon. For instance, most stock and bond transactions in the United States are cleared through the Depository Trust & Clearing Corporation, a private company jointly owned by its member banks and brokers, making it easier for alternative sources of liquidity to crop up and steal market share from the stock exchanges like the NYSE and Nasdaq.
Lastly, we believe CME operates in an attractive industry. The capital markets have historically grown faster than GDP over time, and we believe this trend will continue in the future because of the nature of economic development. In the early stages of development, governments and banks typically provide most of the funding for businesses and consumers. However, as economies develop, governments gradually allow more international investment and the countries’ citizens and businesses also build up excess wealth that they can use for investment, seeding the early formation of capital markets. As these capital markets develop, they eventually become more distributed and efficient investor networks than the banks, and, therefore, cheaper and more reliable sources of capital for businesses and governments.
In summary, we believe the combination of the unrivaled liquidity of CME’s futures exchanges, the nature of futures contracts where they must be opened and closed on the same exchange, and the reinforcing network effects of clearinghouse position netting make it highly likely that CME Group will continue to earn attractive returns on capital by serving as a mission-critical and hard-to-disrupt toll collector on the global capital markets.
Banks vs. Railroads and Waste Collection as Hedges Against Inflation and Deglobalization
One of the functions we believe banks served in our portfolio was as a hedge against prolonged inflation and deglobalization. Many of the other businesses in our portfolio, in recognition of their quality and durability, have higher valuation multiples than the average U.S. stock. Furthermore, most of the businesses in our portfolio are more global than the average U.S. stock. As a result, we believe their businesses and valuations could be more impacted in a world where inflation stays stubbornly high and/or one where governments increasingly favor homegrown, resilient solutions over maximally efficient solutions.
Banks, on the other hand, could potentially benefit from this type of environment. The nearshoring and reshoring of manufacturing could lead to strong wage gains that reinvigorate and broaden the middle class. If this scenario were to occur, we believe this increased middle class buying power and the higher rates needed to control inflation could lead to expanded net interest margins, more loan demand, and contained credit losses. However, the problem with the U.S.’s fragmented banking system is that it merges a highly levered business model with a viciously competitive market in which many banks are price-takers. Therefore, sufficiently large deflationary or inflationary surprises oftentimes result in major banking problems, as we saw in the Global Financial Crisis of 2008 and the stagflationary 1970s. We’ve recently witnessed similar problems with the failures of Silicon Valley Bank, Signature Bank, and First Republic. Even the strongest and best run banks can’t avoid these tail risks completely, as Jamie Dimon has demonstrated at various points over the last few years by halting J.P. Morgan’s share repurchases and building up cash to prepare for a financial storm.
That’s why we became increasingly excited as we did more research on the waste management and rail industries. We believe that they serve as similarly effective hedges in a scenario of high inflation and/or deglobalization while being much less exposed to economic and operational tail risks. For instance, in a scenario of deglobalization that leads to more nearshoring and reshoring and to a financially stronger middle class, railroads have the potential to get a volume tailwind from both more North American industrial production and more consumer goods purchases. Similarly, waste management companies could get a volume tailwind from more industrial waste and more consumer waste.
Furthermore, in the case of railroads, they require far less labor and fuel than their main competitor, the trucking industry. This difference allows them to charge less than 25% of what the trucking industry does (4.4 cents per ton-mile vs. 17.9 cents per ton-mile) yet earn almost 40% operating margins compared to a trucking industry that likely earns less than 5% operating margins.23 In an inflationary environment, trucks may have to increase their prices just to stay profitable. Since the rails charge so much less and make so much more margin, an equivalent price increase will result in a bigger percentage increase in revenue and an even faster increase in profits. Additionally, unlike the banks, which are subject to numerous tail risks but few tail opportunities, the railroads could disproportionately benefit if the U.S. eventually decides to tax trucks for the much larger negative externalities they cause, including public highway damage, accident risk, traffic congestion, and higher carbon emissions. A study published in 2015 by the Congressional Budget Office calculated the external costs of railroads at 0.5 cents per ton-mile and of trucks at 4.0 cents per ton mile, making railroads even more cost effective on a look through basis.24
Lastly, the leading waste management companies and railroads have characteristics that are much more consistent with the other stocks in your portfolio. They are oligopolistic, dominant networks with NIMBY dynamics that make it very tough to add new supply, resulting in more secure enduring pricing power, in our opinion, than we get with the leading banks, which operate in an industry with less consolidation and weaker network effects and, therefore, face aggressive competition that drives the returns on many of their business lines down to their cost of capital.
Concluding Thoughts
In summary, we believe the portfolio changes we’ve made over the last quarter (replacing Meta, Booking, the Chinese tech stocks, and most of the banks with leading players in waste management, railroads, and financial exchanges) have significantly upgraded the quality of your portfolio. The businesses we bought have, in our opinion, stronger, more dominant network effects with much higher switching costs than the businesses we sold, giving us greater confidence that their pricing power will prove enduring.
Additionally, the ownership structures of Meta (where Mark Zuckerberg has super-voting shares) and the Chinese tech stocks (where our ownership is not direct but, rather, through variable interest entities) as well as the tail risks of the banks (which could result in the dilution or wipeout of our equity ownership in a sufficiently bad crisis) have always been worrisome to us. In contrast, Waste Management, Republic Services, Canadian Pacific Kansas City Limited, Canadian National Railway, and Chicago Mercantile Exchange have much stronger minority shareholder protections and, in our opinion, much lower tail risks. Additionally, most of these companies have large shareholders who have a history of holding management accountable and of driving long-term value creation.
Lastly, we believe the waste management companies and Canadian railroads we bought serve as better hedges against a scenario of rising deglobalization and persistent inflation than the banks we sold. If such a scenario were to occur, the waste management companies and railroads could, like the banks, experience both volume and pricing tailwinds, but, unlike the banks, we believe they are subject to far fewer tail risks. Moreover, our higher confidence in their business models allows us to own larger positions in them than we felt comfortable owning in the banks, resulting in a portfolio that we believe is more balanced and, therefore, more capable of surviving and thriving in the wide range of geopolitical and economic environments that the future may bring.
As always, thank you so much for your trust, know that we continue to be invested right alongside you, and please always reach out to us if you have any questions or concerns. We’re here to help!
Sincerely,
The YCG Team
Disclaimer: The specific securities identified and discussed should not be considered a recommendation to purchase or sell any particular security nor were they selected based on profitability. Rather, this commentary is presented solely for the purpose of illustrating YCG’s investment approach. These commentaries contain our views and opinions at the time such commentaries were written and are subject to change thereafter. The securities discussed do not necessarily reflect current recommendations nor do they represent an account’s entire portfolio and, in the aggregate, may represent only a small percentage of an account’s portfolio holdings. A complete list of all securities recommended for the immediately preceding year is available upon request. These commentaries may include “forward looking statements” which may or may not be accurate in the long-term. It should not be assumed that any of the securities transactions or holdings discussed were or will prove to be profitable. S&P stands for Standard & Poor’s. All S&P data is provided “as is.” In no event, shall S&P, its affiliates or any S&P data provider have any liability of any kind in connection with the S&P data. MSCI stands for Morgan Stanley Capital International. All MSCI data is provided “as is.” In no event, shall MSCI, its affiliates or any MSCI data provider have any liability of any kind in connection with the MSCI data. Past performance is no guarantee of future results.
1 For information on the performance of our separate account composite strategies, please visit www.ycginvestments.com/performance. For information about your specific account performance, please contact us at (512) 505-2347 or email [email protected]. All returns are in USD unless otherwise stated.
2 See https://www.wasteinfo.com/diratlas.htm.
3 See https://investors.wm.com/static-files/ad3eab93-1f46-4150-8844-de02ebf9b18b.
4 See https://investor.republicservices.com/static-files/80ed742a-dffc-4640-9407-7c04edb8afab.
5 See https://www.wasteinfo.com/diratlas.htm and https://en.wikipedia.org/wiki/Landfills_in_the_United_States.
6 See https://www.youtube.com/watch?v=uUmtJIBibMM&t=291s, https://www.wastedive.com/news/us-waste-recycling-market-waste-business-journal-2023/650693/, and https://www.bls.gov/data/inflation_calculator.htm.
7 See https://www.statista.com/statistics/1266862/projected-waste-management-market-size-north-america/.
8 See https://investor.cpkcr.com/news/press-release-details/2023/CPKC-adds-1000-reefers-to-expanding-MMX-service/default.aspx.
9 See https://www.cn.ca/en/news/2023/04/cn-updating-2023-guidance-following-strong-first-quarter-perform/.
10 See https://transportgeography.org/contents/chapter5/rail-transportation-pipelines/rail-track-mileage-united-states/.
11 See https://www.aar.org/issue/staggers-act/.
12 See https://www.bts.gov/newsroom/freight-activity-us-expected-grow-fifty-percent-2050.
13 See https://www.bts.gov/content/average-freight-revenue-ton-mile.
14 See https://data.bts.gov/stories/s/Moving-Goods-in-the-United-States/bcyt-rqmu.
15 See https://www.porttechnology.org/news/study-finds-canadian-ports-receive-double-the-amount-of-funding-than-west-coast-ports/#:~:text=A%20study%20commissioned%20by%20ports%20in%20Washington%20and,of%20federal%20funding%20than%20US%20West%20Coast%20ports.
16 See https://reviewlution.ca/resources/canadian-banking-statistics/#:~:text=As%20of%20December%202020%2C%20the%20big%20five,banks%20in%20Canada%20market%20share%20is%20over%2085%25.
17 See https://reviewlution.ca/resources/canadian-banking-statistics/#:~:text=As%20of%20December%202020%2C%20the%20big%20five,banks%20in%20Canada%20market%20share%20is%20over%2085%25.
18 See https://fivethirtyeight.com/features/its-not-just-silicon-valley-bank-americans-havent-trusted-banks-for-years/#:~:text=But%20Americans%20haven%E2%80%99t%20had%20much%20confidence%20in%20banks,%E2%80%94%20including%20banks%20%E2%80%94%20since%20before%20the%201980s.
19 See https://www.statista.com/statistics/727548/market-share-top-banks-thrifts-usa-by-assets/.
20 See https://www.morningstar.com/stocks/xnas/cme/analysis.
21 See https://www.sec.gov/ix?doc=/Archives/edgar/data/1156375/000115637523000020/cme-20221231.htm.
22 See https://www.wsj.com/articles/dark-pools-draw-more-trading-amid-low-volatility-11556886916.
<sup23 See https://www.freightwaves.com/news/solving-the-trucking-profitability-paradox.
24 See https://www.cbo.gov/sites/default/files/114th-congress-2015-2016/presentation/51105-pricing-freight-transport-account-external-costs.pdf.