

The S&P 500 Index returned -3.27% and the S&P Global Broad Market Index returned -3.26% in the quarter ended September 30, 2023.1
At YCG, our investment strategy is to own a diverse collection of global champions that 1) own dominant networks, preferably with high switching costs and untapped pricing power; 2) possess other checks on competing supply such as not-in-my-backyard (NIMBY) zoning restrictions; 3) operate in categories growing at least as fast as GDP; 4) have conservative balance sheets; and 5) are run by ownership-minded management teams. We favor this approach because we believe it results in a portfolio with enduring pricing power that essentially acts as a toll collector on global GDP. By owning this toll-collector portfolio, we believe we can accomplish all our key investment management objectives. First, we believe this portfolio enables us to participate in the upside of long-term global growth. Second, we believe it helps us to survive the negative economic periods such as financial crises, recessions, stagflations, and depressions that we believe are almost certain to occur from time to time but whose start-date, end-date, and severity are likely impossible to predict in advance. Third, we believe it gives us the best chance of delivering above-average risk-adjusted returns over the long-term because of the tendency of investors to be avaricious, impatient, and overconfident, leading to an overvaluation of the most speculative stocks and an almost perpetual undervaluation of the more boring, high-quality stocks on which we focus. Lastly, we believe our strategy positively exposes us to one of the most important drivers of investment performance: return on invested capital trajectory. In other words, businesses with eroding returns on invested capital tend to underperform the stock market, and businesses with improving returns on invested capital tend to outperform the stock market. Because of our investment strategy design, we believe our businesses are more likely than the average business to be in the improving category over time.
We believe this fourth advantage is critical to the success of the strategy, but, in past letters, we’ve only ever discussed it implicitly. Therefore, in the remainder of this letter, we’ll make our thoughts on this topic more explicit. First, we’ll review the concept of return on invested capital. Then, we’ll examine research linking its trajectory to stock market performance. Lastly, we’ll explain why we believe our strategy increases our probability of owning businesses with improving returns on invested capital.
First, let’s review what return on invested capital is and why it’s such an important business metric. Return on invested capital is a calculation that measures how efficiently a business uses the money put into its business. A few examples will help illustrate this concept. If we as investors put a dollar into a business and it produced 1 cent of profit per year, then we would be earning a 1% return on our capital. Unless we had reason to believe that this return on capital would rise over time, this would clearly be a bad use of our dollar since Treasury bills guaranteed by the government currently return 5.5 cents per year per dollar invested, for a return on capital of 5.5%. However, if we as investors put a dollar into a business and it produced 20 cents of profit every year, then we would be earning a 20% return on capital per year. If we could be reasonably confident that putting additional dollars into this business would continue to produce this 20% return, we would be much better off investing in this business than in Treasury bills.
However, the central conundrum of investing is that everyone sees how attractive this return is, and, therefore, competitors rush into the business to try and capture some of these excess profits. One of the main ways they capture this profit is by offering the same product or service at lower prices. Usually, this approach works since most products and services offer value propositions that are relatively easy to copy. To make matters worse, some competitors figure out new ways to drive down the cost of production and others oftentimes invent new products with equivalent or better value propositions. This competition and innovation puts relentless deflationary pressure on profits, driving most businesses’ returns on invested capital down until they equal their cost of capital, which is usually a spread over Treasury bills to account for the greater uncertainty of business cash flows compared to government-guaranteed, short-duration payments.
Investors in the stock and bond markets understand this competitive dynamic quite well. As a result, they typically build in declining returns on capital when pricing above-average businesses. Therefore, those few above-average businesses that maintain or increase their returns on capital over time tend to surprise investors, resulting in market-beating stock performance. Michael Mauboussin, an investment strategist at Morgan Stanley, compellingly demonstrates this point in a chart he created that examines the relationship between return on invested capital trends and stock price performance.2 We’ve reproduced this chart below, and, as we examine it more closely in the paragraphs that follow, we’ll find that it also reveals a more general investment lesson.
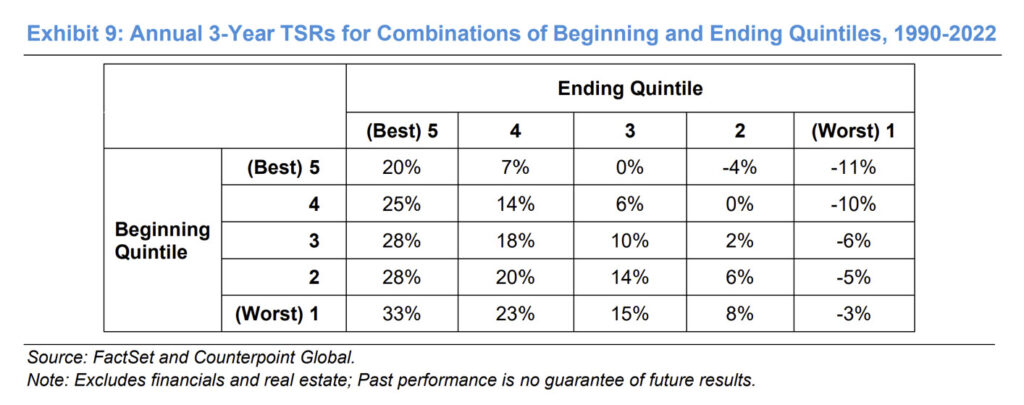
To determine the relationship between return on capital trends and stock price returns, Mauboussin ranks companies from highest to lowest according to their return on invested capital and groups them into quintiles for each year from 1990 to 2022. Then, he calculates rolling three-year total shareholder returns for each stock. Finally, he aggregates this data and determines the rolling three-year total shareholder returns for each combination of beginning and ending return on invested capital quintile rankings. Let’s take a closer look at the chart above and see what we can learn from it. The first thing that jumps out is what a great return we would get if we could invest in best-in-class businesses that stay best-in-class. If we had invested in the group of stocks that started and finished in the best return on invested capital quintiles, then we would have earned an annualized return of 20%. According to our framework, where there is intense competitive pressure on businesses producing high returns on invested capital, this result makes sense. If a business can withstand this pressure for longer than investors expect, we should expect the stock to do well.
Interestingly, however, most instances of above-average total shareholder return resulted not from the most highly ranked businesses maintaining their returns on invested capital but rather from the remaining four quintiles of businesses improving their return on capital rankings over the periods measured. Almost all these cases resulted in significantly better-than-average returns, with the businesses that moved from worst to first gaining a whopping 33% per year. Moreover, every group that moved down in return on invested capital ranking experienced below-average total shareholder returns, with those businesses that moved from first to worst losing 11% percent per year.
The lesson here, in our opinion, is that what’s even more important than finding a high-returning business is finding a business where we believe the return on capital is likely to be maintained or increased over time. That’s why we’re so focused on the long-term supply and demand dynamics of businesses. If the demand for a business’s products and services grows significantly faster over the long term than the supply produced by the business and its competitors, then the price the business can charge its customers is likely to increase at least as fast as inflation. And since most businesses’ cost structures typically rise at a slower rate than inflation because of innovation’s deflationary effects on pricing, a persistent supply-demand imbalance typically leads to higher profits per dollar invested and, therefore, higher returns on capital. As a result, we want to invest in businesses where we have high confidence that demand will grow and similarly high confidence that supply will be constrained. However, satisfying even one of these conditions is challenging but finding both at the same time effectively narrows our investible universe down to only a few dozen businesses.
On the demand side, we know that cultural preferences change over time due to a complex interplay between evolving values and new innovations. For instance, the rise of suburbs, fast fashion, and the internet have changed shopping patterns enough that future department store demand is far from certain. Similarly, changes in work culture due to technology and COVID have put future office space demand in doubt. Even consumer packaged food companies, which produced strong and steady risk-adjusted returns for decades, are not immune. Environmental concerns, higher disposable income, and a growing body of research on the dangers of sugar and processed foods have increasingly shifted consumer preference to more local, organic, and “authentic” foods and have also led to medical innovations such as GLP-1 weight-loss drugs.3 Combined, these factors make the future demand picture for consumer-packaged foods significantly cloudier.
On the supply side, we know that competition comes from everywhere. It comes from celebrity-backed businesses such as The Honest Company and Kylie Cosmetics. It comes from retailers like Walmart and Costco who monetize their growing consumer trust by offering private label products and services. It comes from new or existing competitors who create cheaper manufacturing or production techniques such as oil and gas fracking that allow them to compete more aggressively on price. It comes from companies like Google, Amazon, and Apple that sell seemingly unrelated products but decide they can offer competing products and services as loss leaders to increase customer retention or to drive sales of their other products. It even comes from all of us. The millions of hours of content that we collectively produce and post to the internet every single day4 have created an almost inconceivable number of alternative entertainment options with which Disney and other traditional content producers must now compete. Furthermore, new tools like generative artificial intelligence promise to make the studios’ problems even worse. Once everyone gains the ability to make high-production-value audio and video through voice-activated commands to their A.I. assistant, we believe creativity is likely to explode and competition for eyeballs is likely to get much worse.
As a result of this relentless and unpredictable change, we’ve increasingly tried to invest in businesses that serve economic categories that are as broad as possible, that have structurally grown at least as fast as GDP over the long term, and where we believe the dynamics that led to this growth are likely to remain in place for a long time. Examples include insurance, capital markets, and luxury goods. And then we generally only invest when we believe the businesses that serve these categories possess structural advantages that allow them to control supply. The structural advantage in which we feel most confident is a dominant network. Because network value scales exponentially, businesses that own dominant networks produce far more value for their customers than their smaller competitors, which serves to choke off new supply. While we believe this is one of the most powerful checks on the supply of new competitors, we want as many redundancies as possible, so we prefer industries that not only exhibit network effects but also limit supply in other ways. One of our favorites is not-in-my-backyard zoning restrictions, which have made it almost impossible to build new railroads, landfills, and salvage yards. Another is institutional risk aversion. An employee may lose his job if he chooses a cheaper, less well-known solution that performs poorly, whereas he may only get a pat on the back if the solution performs well. This risk-reward equation creates an incentive to go with the safe choice, constraining new supply and further entrenching the dominant networks in categories such as insurance brokerage, commercial real estate brokerage, credit ratings, and stock market indexing.
Importantly, the network effect is useful not only for choking off new supply (by making larger networks exponentially more valuable than smaller networks, creating little incentive to switch) but also for growing the network’s customer value proposition and, hence, its pricing power as well. In fact, since network value scales exponentially, companies can sometimes increase prices faster than inflation and still experience a widening gap between the price they charge and the value the customer receives, eventually leading to large amounts of untapped pricing power.
Examples of companies with significant untapped pricing power are Moody’s and S&P Global, which both typically charge less than 10 basis points per year to rate a corporate bond issuance5 but save issuers 30 to 50 basis points per year;6 Intuit, which we believe could charge multiples of the current price for QuickBooks and still maintain its market share; and Hermes and Ferrari, which sell the base models of their iconic bags and cars for less than they typically cost on the resale market7 and which often sell their higher-end models for a small fraction of the prices they regularly fetch at auction.8 In these examples where we can identify and then quantify significant untapped pricing power, it gives us even greater confidence that the business can maintain or increase its return on invested capital over time. Furthermore, our study of market history suggests that, when these price-to-value gaps develop, it sets the stage for particularly explosive stock market performance at some point in the future. In fact, many great businesses experienced some of their best stock market performance during periods when management teams closed a large price-to-value gap by rapidly raising prices. Because these price increases were a catch-up to match price with value, they typically didn’t require much additional spending by the businesses. As a result, high percentages of the price increases fell directly to the bottom line, raising returns on invested capital dramatically. And, as the Mauboussin chart above demonstrates, rapid increases in return on capital have historically generated explosive stock market returns. Particularly salient examples of large price-value gaps closing rapidly and resulting in impressive business and stock market performance include See’s Candies price increases in the 1970s after Berkshire Hathaway bought it,9 luxury handbag price increases during the pandemic,10 Apple’s layering on of high margin service revenue to its installed base of loyal Apple users over the last five years,11 and FICO’s up to 400% price increases that it’s begun instituting over the last few years.12
Of course, even if all our companies possessed every one of the attractive attributes we’ve discussed in this letter, we know that competition, innovation, changes in culture, and new regulatory decrees will inevitably alter the economic landscape in major, unpredictable ways over time. However, by assembling a diversified collection of businesses that 1) structurally control supply through networks effects, NIMBY, and institutional risk aversion, 2) often possess large untapped pricing power, and 3) provide mission-critical products that serve broad, attractively-growing economic categories, we believe we’ve created a portfolio that is well-positioned to benefit from the correlation between increasing returns on invested capital and above-average total shareholder returns.
Conclusion
Investors tend to be relatively good at assessing business quality. They typically price great businesses at valuation premiums to the stock market, and they typically price bad businesses at discounts. However, despite this clear valuation disparity, both academic research13 and our own experience suggest that investors still don’t price great businesses expensively enough or bad businesses cheaply enough. We believe this phenomenon occurs because investors want to get rich quick and are overconfident in their ability to do so, resulting in a “lottery” premium being applied to the average speculative stock and a “boredom/impatience” discount being applied to the average high-quality stock. In addition, high-quality businesses have tended to outperform most businesses during economic downturns, and, especially, during the most severe ones.14 As a result, investors in high quality stocks have historically earned market-beating returns with, arguably, less risk as well.15 Because we believe the behavioral biases that led to this attractive risk-adjusted performance are unlikely to change, the bedrock of our strategy has always been to own a diverse collection of high-quality businesses.
However, another important lesson of stock market research is that trends in business quality have historically been even more powerful drivers of stock market performance than the absolute level of business quality. Therefore, we’ve tried to narrow down our investible universe to only those high-quality businesses that we believe are likely to maintain or, even better, grow their returns on invested capital over time. In our experience, these businesses typically own a dominant network with additional constraints on new competitive supply such as NIMBY zoning restrictions and institutional risk aversion. Furthermore, they operate in broad categories where we believe there is a high probability of continued demand growth at rates at least as fast as GDP over time. This combination of supply constraint and demand growth makes it likely, in our opinion, that these businesses can raise prices at a faster rate than their costs increase, leading to higher returns on capital over time. Moreover, a small number of these companies have grown their network value much faster than they’ve raised prices, leading to large price-value gaps that we call untapped pricing power. Sometimes, usually due to management, regulatory, macroeconomic, or customer contract changes, these companies choose to rapidly raise prices to close this gap, causing explosive return on invested capital growth.
By owning a diverse collection of these high-quality businesses with favorable supply-demand dynamics and, in some cases, significant untapped pricing power, we believe we’ve positioned the portfolio to benefit from both the “high-quality” mispricing and the link between increasing returns on invested capital and investment outperformance. Furthermore, we believe that incorporating multiple important investment drivers into our strategy increases its robustness and, therefore, the likelihood that your portfolio will be able to maintain and grow its purchasing power across the many possible futures the world could face.
As always, thank you so much for your trust, know that we continue to be invested right alongside you, and please always reach out to us if you have any questions or concerns. We’re here to help!
Sincerely,
The YCG Team
Disclaimer: The specific securities identified and discussed should not be considered a recommendation to purchase or sell any particular security nor were they selected based on profitability. Rather, this commentary is presented solely for the purpose of illustrating YCG’s investment approach. These commentaries contain our views and opinions at the time such commentaries were written and are subject to change thereafter. The securities discussed do not necessarily reflect current recommendations nor do they represent an account’s entire portfolio and, in the aggregate, may represent only a small percentage of an account’s portfolio holdings. A complete list of all securities recommended for the immediately preceding year is available upon request. These commentaries may include “forward looking statements” which may or may not be accurate in the long-term. It should not be assumed that any of the securities transactions or holdings discussed were or will prove to be profitable. S&P stands for Standard & Poor’s. All S&P data is provided “as is.” In no event, shall S&P, its affiliates or any S&P data provider have any liability of any kind in connection with the S&P data. MSCI stands for Morgan Stanley Capital International. All MSCI data is provided “as is.” In no event, shall MSCI, its affiliates or any MSCI data provider have any liability of any kind in connection with the MSCI data. Past performance is no guarantee of future results.
1 For information on the performance of our separate account composite strategies, please visit www.ycginvestments.com/performance. For information about your specific account performance, please contact us at (512) 505-2347 or email [email protected]. All returns are in USD unless otherwise stated.
2 See https://www.morganstanley.com/im/publication/insights/articles/article_returnoninvestedcapital.pdf.
3 A class of drugs such as Ozempic and Wegovy that are approved for weight loss and/or type 2 diabetes and that also show promise in curbing addictive behaviors like smoking and drinking. See https://www.healthline.com/health/weight-loss/glp1-for-weight-loss#glp-1-drugs-for-weight-loss and https://www.healthline.com/health-news/ozempic-could-help-treat-addiction.
4 See https://www.tubefilter.com/2019/05/07/number-hours-video-uploaded-to-youtube-per-minute/. The 720,000 number derived from YouTube management’s comments is likely to have grown substantially since 2019 and doesn’t include audio and video uploaded to TikTok, Instagram, Facebook, Twitch, and the many other social media platforms that exist today.
5 See https://web.archive.org/web/20191031183406/https://www.standardandpoors.com/en_US/delegate/getPDF?articleId=2148688&type=COMMENTS&subType=REGULATORY. Given the duopolistic nature of the industry, we believe Standard & Poor’s pricing is a good proxy for Moody’s.
6 In 2012, for the first time in its history, Heineken decided to get its debt rated. Based on Heineken’s post-mortem analysis, this decision saved the company 30 to 50 basis points of yearly interest cost. See https://web.archive.org/web/20170713073100/http://treasurytoday.com/2013/02/do-companies-need-to-be-rated-to-issue-bonds.
7 See https://www.wsj.com/articles/even-hermes-shoppers-cant-escape-the-supply-chain-crunch-11634812184 and https://drivefoundry.com/buying-guides/ferrari-a-guide-to-depreciation/#:~:text=Due%20to%20the%20limited%20supply%20and%20lengthy%20wait,as%20an%20example%2C%20when%20new%20they%20are%20%C2%A3230%2C000.
8 See https://web.archive.org/web/20220318223542/https://www.sothebys.com/en/articles/demystifying-the-hermes-himalaya-birkin, https://www.sothebys.com/en/articles/hermes-birkin-and-kelly-bags-lead-sothebys-most-expensive-handbags-sold-at-auction, and https://www.continentalautosports.com/ferrari-information/how-much-do-ferraris-cost/.
9 See https://www.gurufocus.com/news/229239/pricing-a-box-of-candy-warren-buffett-sees.
10 See https://wwd.com/fashion-news/fashion-scoops/why-prices-designer-handbags-increasing-1235064628/#!.
11 See https://www.nasdaq.com/articles/how-apple-is-squeezing-out-more-profit-from-its-iphones-2021-02-04, https://appleinsider.com/articles/21/07/27/apple-services-revenue-breaks-q3-record-on-33-growth, and https://www.morningstar.com/stocks/xnas/aapl/performance.
12 See https://www.housingwire.com/articles/mortgage-group-asks-regulators-to-stop-ficos-price-hikes-of-up-to-400/#:~:text=The%20letter%2C%20signed%20by%20NCRA%20Executive%20Director%20Terry,for%20all%20other%20mortgage%20lenders%20in%20the%20nation.%E2%80%9D.
13 See https://www.stockopedia.com/guides/factor-investing/the-quality-factor/.
14 See https://www.scribd.com/document/30407102/GMO-Grantham-Quarterly-Apr10 in which GMO details the dramatic outperformance of high-quality stocks during the Great Depression.
15 See https://www.institutionalinvestor.com/article/2bsymbsfldxbb6unsk268/innovation/deconstructing-high-quality-equity-outperformance#:~:text=The%20stocks%20of%20high-quality%20firms%20%E2%80%94%20characterized%20by,experience%20lower%20variability%20and%20reduced%20drawdowns%20during%20recessions.