
The S&P 500 Index returned -4.88% and the S&P Global Broad Market Index returned -6.58% in the quarter ended September 30, 2022, driving the markets even further into bear market territory.1, 2
While bear markets are never pleasant, it’s important to remember that these periods of downward volatility are quite common, have historically been relatively brief compared to the much longer bull market periods, and are the price we all must pay for the excess returns that the stock market has historically generated over the long term. Let’s delve further into each of these points in the remainder of this letter.
First, as the chart below demonstrates, bear markets are quite common, having historically occurred in the U.S. stock market roughly every five to seven years.
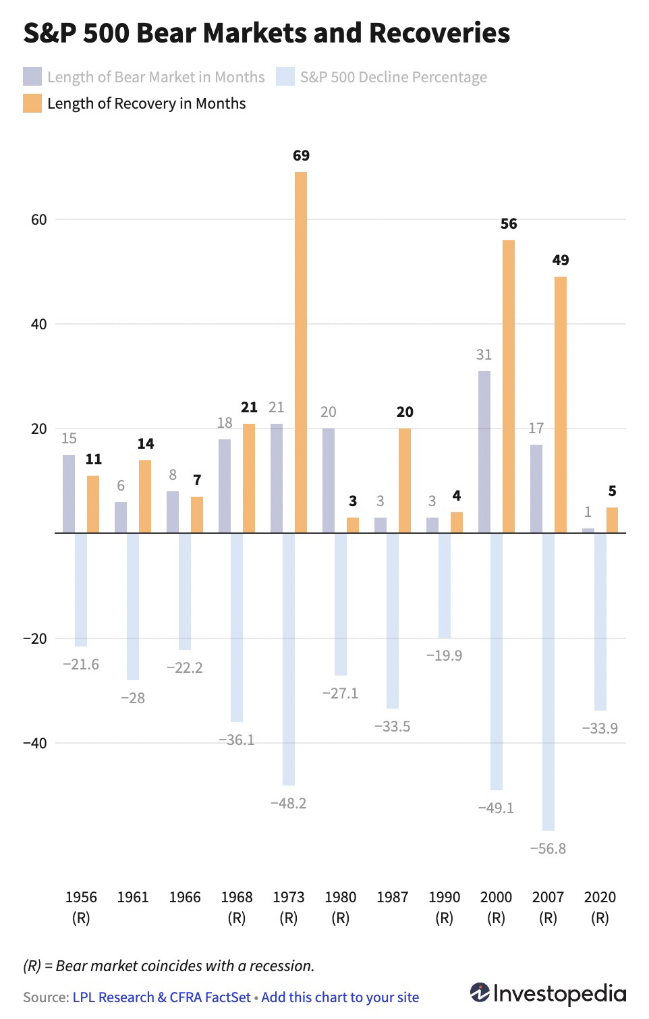
Recently, however, we have been spoiled because the index in our backyard, the S&P 500, just experienced an extraordinary 11-year period from 2009 to 2020 of unusually steady price increases. Furthermore, the 2020 bear market that broke this streak, while high in percentage decline, was both abnormally short and followed by rapid and prodigious gains as a result of the unprecedented stimulus the government instituted to fight COVID-related economic problems. Going forward, however, it’s probably wise to prepare for a more historically normal cadence of bear markets. The chart above shows 65 years of investing history, which we believe is a reasonable enough approximation of an investing lifetime. Of course, future returns and volatility could turn out to be better or worse than the past, but we think a sensible investor’s base case should include at least as many down periods as we’ve historically experienced. Thus, we should all reasonably expect to experience roughly twelve periods of greater than 20% peak to trough losses, six periods of greater than 33% losses, and three periods of approximately 50% losses during our lifetime.
We all wish we could avoid these periods by selling out of and buying back stocks at just the right time, but, because of the radical unpredictability of both the economy and the stock market, we’ve never been able to find any convincing evidence that supports the notion that an investor can consistently achieve this desired downside volatility avoidance. In fact, all the academic research supports the contrary position, that all equity investors are likely to experience multiple painful periods of portfolio price declines. Even Warren Buffett, widely considered to be the greatest investor of all time, has experienced at least three approximately 50% declines in his net worth, as can be seen in the chart below of Berkshire Hathaway’s worst stock price drawdowns.3
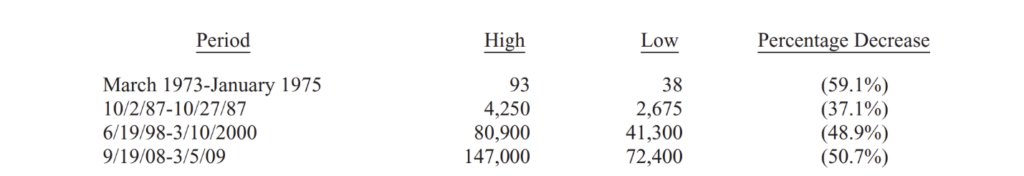
The unfortunate reality is that there is no way around these periods. Rather, the best we can all do is to persevere through them.
The second thing to remember about bear markets is that they have historically been relatively brief compared to the much longer bull market periods. Below we’ve included a graphical representation of historical bear and bull markets that dramatically demonstrates this point.
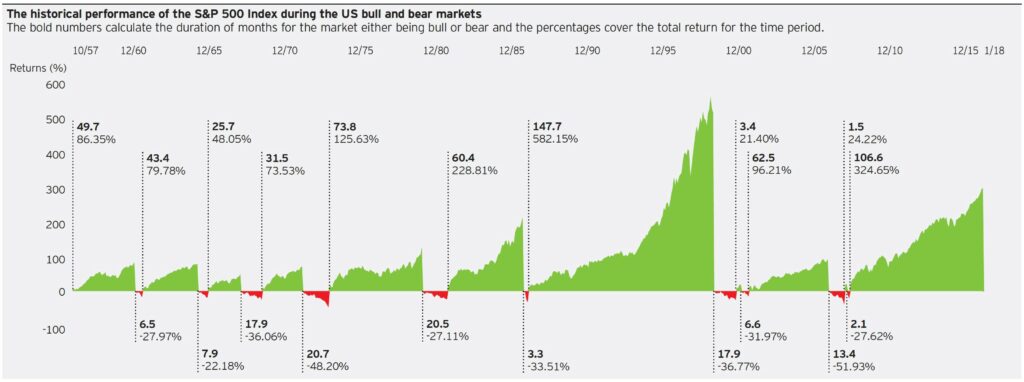
Source: Invesco and Bloomberg L.P. Returns from 10/22/1957–12/31/18.4
As you can see, bull markets have typically been many multiples longer in duration than bear markets and their price gains have usually more than made up for any losses experienced during the bear market periods. Of course, in the moment, bear markets feel endlessly long. But this graph reminds us that our current bear market will end and that, if history is any guide, the bull market that emerges is likely to be much longer in duration and much more powerful in scope. The graph also reminds us that equity investing has, over the long-term, grown investors’ wealth, which leads us to our third and last point about bear markets.
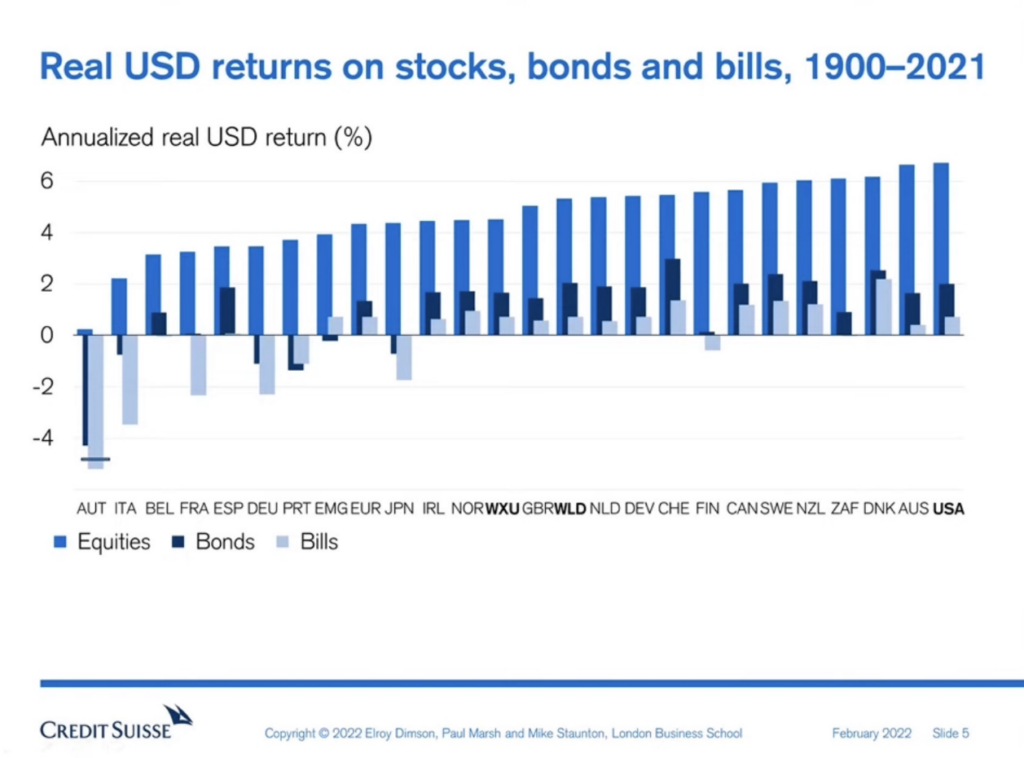
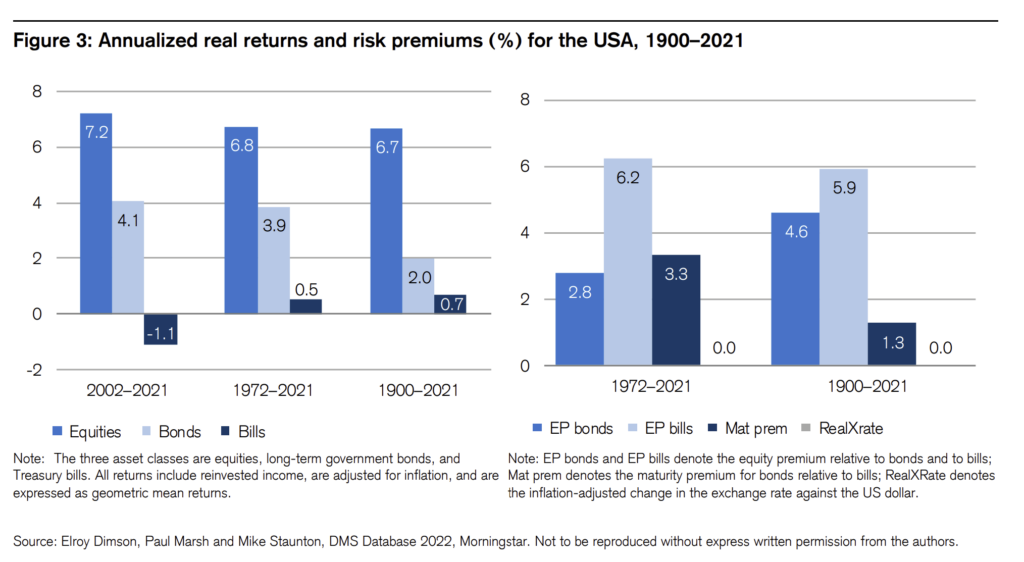
Bear markets are, unfortunately, the price we all must pay to capture the excess returns that equity markets have historically generated. And these excess returns have been sizeable and consistent, as can be seen in the chart below, which demonstrates that stocks have handily outperformed government bonds and bills in all 23 of the countries with continuous capital market histories during the period from 1900 to 2021.
And while we find this chart to be incredibly compelling, its one downside is that it doesn’t adequately demonstrate the power of compound growth. This downside is significant since, as researchers Matthew Levy and Joshua Tasoff write in one of the many studies on exponential growth bias, we humans systematically “underestimate the magnitude of compounding interest” and “are overconfident in [our] ability to answer questions that involve exponential growth.”5 In our experience, this lack of appreciation for compound growth causes most people to vastly underestimate the benefit investors have historically been able to achieve if they’re willing to put up with the stock market’s higher volatility. For a demonstration of this extraordinary benefit, let’s turn to possibly our favorite chart on equity investing, shown below.
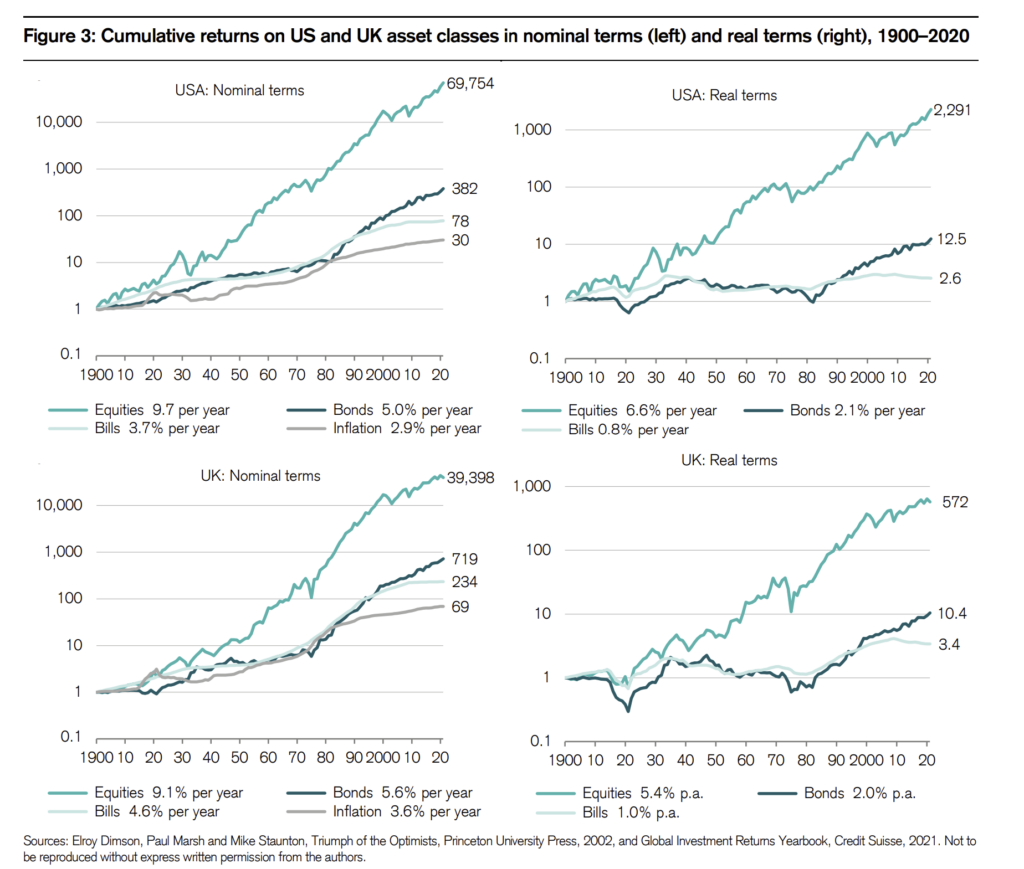
As you can see in the chart, from 1900 to 2020, both U.S. and U.K. stocks performed dramatically better than bonds and bills. U.S. stocks were a particular standout, multiplying real wealth by an almost unbelievable 2,291x versus only 12.5x for bonds and 2.6x for bills. U.K. stocks also produced incredible results over this time period, multiplying real wealth by 572x versus only 10.4x for bonds and 3.4x for bills. Of course, barring major medical breakthroughs, a 120-year period isn’t a very useful period for most of us to consider. However, 50 years certainly is, and over the period from 1972 to 2021, even with a smaller annualized excess return over bonds (see chart below), U.S. stocks multiplied investors’ purchasing power by 27x compared to just 6.8x for bonds and 1.3x for bills.
Just as we do with the graph of bull and bear markets we shared earlier, we find it tremendously helpful during bear markets to review the charts above comparing the long-term performance of stocks, bonds, and bills. They remind us that the benefits of long-term equity investing have historically been both universal and enormous and that, if we persevere, we will likely be richly rewarded.
Concluding Thoughts
Bear markets are painful and psychologically dangerous. The pain of losing money can cause us to shorten our time horizons and can even distort our views of reality, causing us to overweight the importance of the negative sum forces currently plaguing us such as war and political polarization and underweight the importance of the historically much more powerful positive sum forces of cooperation and human innovation. As an antidote to this emotional pain and the distorting effect it can have on our view of reality, we have found it helpful to remember three things about bear markets. We will experience many of them during our investing lifetimes, they have typically been brief and followed by longer and more powerful bull markets, and they are, unfortunately, the price we all have to pay for the enormous excess returns that long-term equity investing has historically provided over government bonds and bills. In sum, while the current bear market has resulted in significant mark-to-market losses, it is our belief that, if history is any guide, the highest prices are yet to come.
As always, thank you so much for your trust, know that we continue to be invested right alongside you, and please always reach out to us if you have any questions or concerns. We’re here to help!
Sincerely,
The YCG Team
Disclaimer: The specific securities identified and discussed should not be considered a recommendation to purchase or sell any particular security nor were they selected based on profitability. Rather, this commentary is presented solely for the purpose of illustrating YCG’s investment approach. These commentaries contain our views and opinions at the time such commentaries were written and are subject to change thereafter. The securities discussed do not necessarily reflect current recommendations nor do they represent an account’s entire portfolio and, in the aggregate, may represent only a small percentage of an account’s portfolio holdings. A complete list of all securities recommended for the immediately preceding year is available upon request. These commentaries may include “forward looking statements” which may or may not be accurate in the long-term. It should not be assumed that any of the securities transactions or holdings discussed were or will prove to be profitable. S&P stands for Standard & Poor’s. All S&P data is provided “as is.” In no event, shall S&P, its affiliates or any S&P data provider have any liability of any kind in connection with the S&P data. MSCI stands for Morgan Stanley Capital International. All MSCI data is provided “as is.” In no event, shall MSCI, its affiliates or any MSCI data provider have any liability of any kind in connection with the MSCI data. Past performance is no guarantee of future results.
1 For information on the performance of our separate account composite strategies, please visit www.ycginvestments.com/performance. For information about your specific account performance, please contact us at (512) 505-2347 or email [email protected]. All returns are in USD unless otherwise stated.
2 Bear markets are typically defined as prolonged periods of market losses during which the broad market indices decline by at least 20%.
3 Buffett included this chart in Berkshire Hathaway’s 2017 annual report.
4 The S&P 500 Index is an unmanaged index of 500 stocks used to measure large-cap US stock market performance. Investors cannot invest directly in an index. Index returns do not reflect any fees, expenses, or sales charges. This chart is for illustrative purposes only and not indicative of any actual investment. These returns were the result of certain market factors and events which may not be repeated in the future. Past performance is no guarantee of future results.