


**After quarter end, President Trump announced unprecedented tariffs on many countries around the world, setting off a worldwide stock market decline. We sent you an email with our thoughts on these events, which we have posted on our wwebsite.1 For your convenience, we have also included it as an appendix to this letter.**
The S&P 500 Index returned -4.27% and the S&P Global Broad Market Index returned -1.54% in the quarter ended March 31, 2025.2
In our last letter, we wrote about our concerns regarding market concentration in the artificial intelligence (AI) trade. We suggested that markets were potentially underestimating the risks that demand for AI services could fall short of expectations or that innovation could cause AI supply to grow faster than expected. Shortly thereafter, a previously unheralded Chinese startup called DeepSeek released an innovative AI model that many experts believe runs on much less energy and far fewer semiconductors than leading U.S. AI models.3 Additionally, reports surfaced that Microsoft has withdrawn from at least two gigawatts of data center projects.4 Lastly, DOGE-driven cuts in government spending combined with rising tariffs heightened investors’ concerns about the potential for stagflation. Taken together, these news items drove the underperformance of both cyclical and AI-related names and the outperformance of more defensive, consumer staple-like companies.
We used this strength in defensives to rebalance down our position in CME Group and to exit our position in L’Oreal. While L’Oreal is extremely well-managed and has a strong position in the durably fast-growing beauty category, we have learned over time that barriers to new competitive supply are at least as important as a durably growing market. And, on this metric, we believe beauty is increasingly coming up short. While the barriers to entry in beauty have never been insurmountable, they seem to be declining at a much more rapid pace due to the global rise of social media, the broadening of the cosmetics manufacturing base, and the proliferation of alternative sources of distribution such as Amazon and Shopify, causing us to grow increasingly unsure that L’Oreal can maintain and increase its returns on invested capital over the long term. As a result, we have chosen to exit the stock.
With the proceeds from these sales as well as from the partial sale of our position in the railroads, we initiated positions in the three largest businesses in the American aggregates sector, CRH plc, Vulcan Materials Company, and Martin Marietta Materials. Aggregates are raw materials such as gravel, crushed stone, and sand that are extracted from rock pits and quarries. They are mission-critical ingredients in concrete, asphalt, and other construction materials, and, as such, they are used in almost all commercial real estate, residential real estate, and public infrastructure projects. Because of the stagflation fears that gripped investors in the first quarter, these businesses underperformed our more defensive positions in CME Group and L’Oreal and even our positions in the similarly cyclical railroads, giving us what we believe was an attractive opportunity to diversify into the three leading North American aggregates businesses.
In the remainder of this letter, we’ll explain why, in contrast to the beauty business, we find both the demand and supply prospects of the aggregates business to be so favorable over the long term.
CRH, Vulcan Materials, Martin Marietta Materials
CRH is the largest aggregates company in the Americas with 230 million tons of aggregates sold, primarily in the U.S., in 2024 (~9.5% U.S. market share5) and 18.4 billion tons of proven and probable reserves.6 Vulcan Materials is the second largest aggregates company in the Americas with 224 million tons of aggregates sold in 2024 (~9.5% U.S. market share) and 16.5 billion tons of proven and probable reserves.7 Martin Marietta is the third-largest aggregates company in the Americas with 191 million tons of aggregates sold in 2024 (~8.0% U.S. market share) and 16.8 billion tons of proven and probable reserves.8 The companies also provide cement and downstream products such as ready mixed concrete, asphalt and paving services. In addition, CRH has a large international business with 143 million tons of aggregates sold in Europe, Australia, and the Philippines and 4.5 billion tons of proven and probable reserves in these countries, and it also offers various other building products and construction services with the goal of providing its customers with complete connected solutions.
Given that aggregates are merely gravel, crushed stone, and sand, commonplace materials found in many locations around the world, why are the leading producers good businesses?
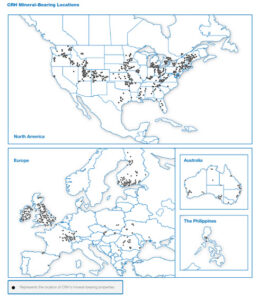
First, they all benefit from extensive physical network effects that reduce their costs and increase their networks’ utilization. Larger networks also generally allow companies to better serve their customers with faster and more reliable service than smaller competing networks. Below are maps of each company’s mining properties.
CRH’s network includes 1,296 mineral-bearing properties located in North America, Europe, Australia, and the Philippines (see map below).9
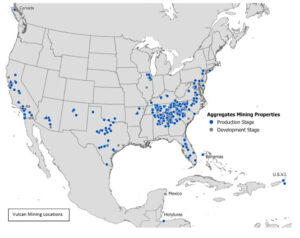
Vulcan Materials’ network includes 423 active aggregates facilities across the U.S. and in the Bahamas, Canada, Honduras, Mexico and the U.S. Virgin Islands (see map below).10
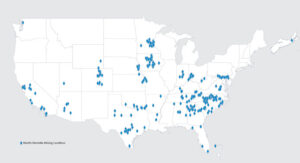
Martin Marietta Materials’ network includes approximately 390 quarries, mines and distribution yards in 28 states, Canada and The Bahamas (see map below).11
In addition to their network advantages, the aggregates companies also benefit from a not-in-my-backyard (“NIMBY”) dynamic that makes it extremely difficult for new supply of aggregates mines to enter the market. In fact, because of NIMBY and industry consolidation, the number of U.S. aggregate mines has grown by only 13% from 9,269 in 1983 to 10,484 in 202312 despite the U.S.’s population having increased by 43%13 and the tons of aggregates used per year having risen by 83%.14
Lastly, because aggregates are dense and heavy but also relatively straightforward to mine compared to the more complex processes involved in mining and manufacturing most other goods, they benefit from having an extremely low value-to-weight ratio. This dynamic means that the cost of transporting aggregates quickly exceeds their value (with the delivered price doubling somewhere between 23 and 45 miles15), making it uneconomic for non-local aggregates facilities to supply construction sites in most circumstances. As a result, 90% of aggregates are consumed within 50 miles of the place of extraction.16 Combined with NIMBY, this uneconomic nature of non-local aggregate shipping often turns aggregates mines into local monopolies and oligopolies.
It’s no wonder, then, that steadily rising demand for aggregates has resulted in U.S. aggregates prices rising from $1.68 per ton in 1971 to $16.16 per ton in 2024.17 This price increase translates into a compound annual growth rate of 4.4% per year, which comfortably exceeds inflation’s compound annual growth rate of only 3.9% per year over the same period. Despite these price increases, aggregates remain a small percentage of total construction costs. For aggregate-intensive projects like highway construction, where they often comprise 90%+ of the materials used,18 aggregates only account for 5 to 10% of total costs.19 For commercial and residential construction projects, where aggregates make up a smaller percentage of the materials, the cost as a percentage of the total construction cost is even less. Moreover, according to various construction indices, total construction costs have also consistently grown faster than inflation for decades, 20 suggesting that aggregates have an ample future pricing runway.
Going forward, with aggregates demand projected to grow,21 NIMBY and regulatory costs continuing to rise, and the network value of the largest industry participants continuing to increase more quickly than smaller competitors through consolidation and market share gains, we believe industry leaders CRH, Vulcan Materials, and Martin Marietta Materials will continue to grow their pricing, revenue, and profits faster than inflation for years to come.
A note on cyclicality
As you may have noticed, our thesis on these stocks is almost identical to our thesis on the waste management companies. Our shorthand way of describing both investment cases is that physical networks plus NIMBY plus increased demand plus tuck-in acquisitions of smaller competitors have historically and, we believe, will continue to result in long-term pricing power and attractive stock returns. However, one big difference between the two is that aggregate volumes are much more cyclical over time than waste volumes. Given this important difference, it makes sense to spend a minute discussing our perspective on it. In our view, there are three things to consider: 1) Are construction volumes likely to be lower or higher in the near term? 2) Are construction volumes likely to be lower or higher in the long term? 3) Do we have a view on whether the market is mispricing these outlooks?
The first question of whether construction volumes are likely to be lower or higher in the near term is one to which we, frankly, don’t know the answer. We don’t think we can reliably predict macroeconomic cycles, and we’ve never seen convincing data that anyone else can either. However, we would note that this near-term uncertainty doesn’t endanger the aggregates investment case. The leading companies have a great track record of surviving industry downturns primarily because of their ability to maintain, and often increase, their prices during periods of falling volumes.
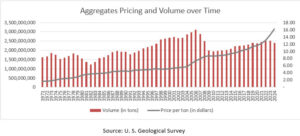
As you can see from the chart above, aggregates prices have risen at a remarkably steady pace over time. In fact, there were only five years in this 53-year span during which prices declined. Moreover, these declines were quite modest, with an average decline of -1.7% and a maximum decline of -3.7%. Amazingly, prices were stable even during the dramatic fall in volumes that occurred from 2006 to 2010 as a result of the U.S. housing bust and subsequent Global Financial Crisis. Prices only fell in one of these years (2010) and by just 1.8%.
This price inelasticity is because of the factors that we discussed earlier (NIMBY plus uneconomic non-local transportation costs) but also because of one other factor. Aggregate mines are small, open pits that aren’t very complex to mine. Therefore, unlike larger open-pit mining, underground mining, and complex manufacturing, aggregate mining has lower fixed infrastructure costs and can be more easily and cost-effectively stopped and started. This flexibility allows producers to quickly and significantly reduce costs during industry downturns, further lowering the likelihood of financial strain. Taken together, the combination of NIMBY plus uneconomic non-local transportation costs plus the low cost of starting and stopping dramatically reduces both the ability and incentives of competitors to engage in aggressive price competition to win volume.
On the second question of whether construction volumes are likely to be higher or lower over the long term, we believe the data suggests that long-term volume is likely to be higher than current volume. Since 1971, aggregates volume has grown by a compound annual growth rate of approximately 0.7% per year. Despite slowing population growth, we believe aggregates volumes are likely to grow at a similar (or perhaps even faster) rate in the future. Our case for this optimism relies on the fact that there is significant pent-up demand in all three categories that use aggregates (residential real estate, commercial real estate, and infrastructure). There are currently supply constraints that are preventing adequate construction in each of these areas, but we believe each of these constraints is likely to be relaxed at some point.
In residential real estate, restrictive zoning laws, the decimation of homebuilders after the 2008 housing crash, and pandemic-related supply problems have created an estimated shortage of as many as 6.5 million houses in the U.S.22 We believe political pressure from young voters who feel locked out of the housing market is growing and that the constraints on building will eventually be relaxed, providing an additional tailwind to residential real estate growth.
In commercial real estate, we believe that the structural shortage resides mainly in industrial real estate. The one-two punch of the pandemic and rising geopolitical tensions has convinced most Americans that we underinvested in both our and our allies’ manufacturing bases over the last fifty years. This realization has resulted in increased onshoring and nearshoring activity that could provide a long-term boost to commercial real estate growth rates.
In infrastructure, we believe increased regulatory hurdles and the crowding out of infrastructure spending by more politically expedient types of government spending have both caused massive infrastructure underinvestment. The evidence of this underinvestment is abundant. For instance, according to the World Economic Forum Global Competitiveness Report, which compares countries’ infrastructure across a wide variety of metrics, the quality of U.S. infrastructure has steadily declined over the past few decades relative to peers. Given that the U.S. spends less as a percentage of GDP on infrastructure than most of these countries, this finding is unsurprising. In some cases, the differences are stark. For instance, in 2021, China spent 4.8% of GDP on transportation and Germany, France, Italy, the U.K., Japan, and Australia spent between 0.8% and 1.5% of GDP. The U.S. spent a mere 0.5% of GDP.23 It’s not just international organizations that make the underinvestment claim, either. In its 2025 report, the American Society of Civil Engineers gave U.S. infrastructure a grade of C and estimated total investment needs of $9.1 trillion to bring our infrastructure into a state of good repair.24 While the 2021 Infrastructure Investment and Jobs Act (“IIJA”) has resulted in some progress towards this goal, a $3.7 billion funding gap exists over the next 10 years, even including this spending. Moreover, whether one should fully include this spending is not clear because the IIJA expires in 2026, yet only 68% of the funding for IIJA has been allocated and just 35% has been disbursed as of February 2025.25 This slower-than-expected progress serves as powerful evidence that our country’s building policies are not sufficiently streamlined. Given that our infrastructure is vitally important to both our national security and our country’s future growth (with every dollar invested in public infrastructure estimated to lead to $1.50 in additional economic activity26), we believe the political will to streamline building policies and fund infrastructure is likely to rise over time. This increase, combined with the trend toward onshoring and nearshoring, could accelerate infrastructure spending growth.
Lastly, as shown on the aggregates pricing and volume chart above, aggregates volumes are still 23% lower than their 2006 peak, which is now almost 20 years ago. We believe this datapoint provides further support to each subsector’s claim of undersupply. It also gives us greater confidence in our view that aggregate volumes could grow somewhat faster in the future than they did over the last few decades.
On the third question of whether the market is mispricing aggregates volume growth, our view is that they likely are, both because of the market-timing mispricing and because of investors’ tendency to underestimate long-term risks and opportunities. Investors want to get rich quickly and are overconfident about their ability to do so, and, as a result, they tend to make numerous behavioral errors. First, we believe they tend to underestimate the duration over which high-quality companies can maintain or increase their returns on invested capital, which we call the high-quality mispricing. Because of network effects, NIMBY, and long-term demand, we believe the aggregates benefit from this mispricing. Second, we believe investors tend to overestimate their ability to predict the timing, duration, and magnitude of industry downturns and, thus, tend to underprice stocks, especially cyclical ones, during times of economic or geopolitical turmoil. We call this the market-timing mispricing, and we believe current investor fears about a recession have led to aggregates being undervalued in this way as well. Third, we believe investors tend to underprice both long-term risks and long-term opportunities since most plan to hold stocks for only relatively short periods of time. Here, we think aggregates benefit yet again because we believe investors are underpricing the release of pent-up demand in residential real estate, industrial real estate, and infrastructure that may occur if barriers to new supply are eventually removed.
In summary, we think CRH, Vulcan Materials, and Martin Marietta Materials possess all the elements necessary (dominant physical networks plus NIMBY plus increasing demand) to serve as durable toll collectors on North American and, to a lesser extent, global construction.
Concluding Thoughts
We believe selling L’Oreal, trimming CME Group and the railroads, and adding the aggregates has upgraded the quality of your portfolio. In our opinion, the aggregate companies’ combination of network effects plus NIMBY dynamics makes them much more likely than L’Oreal to maintain or increase their returns on invested capital over time. Furthermore, by reducing our holdings in the railroads and CME Group and buying the aggregates, we continued to increase the diversity of your portfolio’s cash flows. In a world where economic and geopolitical risks appear to be rising, we believe this increased diversity of cash flows further strengthens your portfolio’s robustness to the many possible futures ahead of us, and we would highlight the rapid sell-off in AI stocks on the surprising DeepSeek and Microsoft news as strong evidence of this benefit.
As always, thank you so much for your trust, know that we continue to be invested right alongside you, and please always reach out to us if you have any questions or concerns. We’re here to help!
Sincerely,
The YCG Team
Disclaimer: The specific securities identified and discussed should not be considered a recommendation to purchase or sell any particular security, nor were they selected based on profitability. Nothing said in this piece may be considered to be an offer to buy or sell any security. Rather, this commentary is presented solely for the purpose of illustrating YCG’s investment approach. These commentaries contain our views and opinions at the time such commentaries were written and are subject to change thereafter. The securities discussed do not represent an account’s entire portfolio and in the aggregate, may represent only a small percentage of an account’s portfolio holdings. These commentaries may include “forward looking statements” which may or may not be accurate in the long-term. It should not be assumed that any of the securities transactions or holdings discussed were or will prove to be profitable. Data presented was obtained from sources deemed to be reliable, but no guarantee is made as to its accuracy. S&P stands for Standard & Poor’s. All S&P data is provided “as is”. In no event, shall S&P, its affiliates or any S&P data provider have any liability of any kind in connection with the S&P data. No further distribution or dissemination of the S&P data is permitted without S&P’s prior express written consent. All MSCI data is provided “as is.” In no event, shall MSCI, its affiliates or any MSCI data provider have any liability of any kind in connection with the MSCI data. Past performance is no guarantee of future results.
1 See https://ycginvestments.com/ycg_perspective/tariff-turbulence-market-update/.
2 For information on the performance of our separate account composite strategies, please visit www.ycginvestments.com/performance. For information about your specific account performance, please contact us at (512) 505-2347 or email [email protected]. All returns are in USD unless otherwise stated.
3 See https://www.digidop.com/blog/deepseek-vs-chatgpt#:~:text=Environmental%20impact%20is%20drastically%20reduced,costs%2080%25%20lower%20than%20OpenAI’s.
4 See https://www.datacenterdynamics.com/en/news/microsoft-steps-back-from-data-center-developments-globally-report/.
5 Since all three companies have nearly all their production in the U.S., we calculated market share by dividing their total Americas production by total U.S. production of 2.39 billion tons (see https://pubs.usgs.gov/periodicals/mcs2025/mcs2025.pdf).
6 See the CRH 2024 10-K.
7 See the Vulcan Materials 2024 10-K.
8 See the Martin Marietta Materials 2024 10-K.
9 See the CRH 2024 10-K.
10 See the Vulcan Materials 2024 10-K.
11 See the Martin Marietta Materials 2024 10-K.
12 See https://wwwn.cdc.gov/niosh-mining/MMWC/Mine?utm_source=perplexity.
13 See https://datacommons.org/place/country/USA?utm_medium=explore&mprop=count&popt=Person&hl=en.
14 https://www.usgs.gov/centers/national-minerals-information-center/natural-aggregates-statistics-and-information and https://pubs.usgs.gov/periodicals/mcs2025/mcs2025.pdf.
15 See https://www.nssga.org/sites/default/files/2021-04/AggregatesIndustry2017ScorecardFinal.pdf.
16 See https://www.nssga.org/sites/default/files/2021-04/AggregatesIndustry2017ScorecardFinal.pdf.
17 See https://www.usgs.gov/centers/national-minerals-information-center/natural-aggregates-statistics-and-information and https://pubs.usgs.gov/periodicals/mcs2025/mcs2025.pdf.
18 See https://www.nssga.org/sites/default/files/2021-04/AggregatesIndustry2017ScorecardFinal.pdf.
19 See https://pubs.usgs.gov/of/2011/1119/pdf/OF11-1119_report_508.pdf.
20 See https://www.construction-physics.com/p/does-construction-ever-get-cheaper.
21 See https://www.persistencemarketresearch.com/market-research/construction-aggregates-market.asp.
22 See https://www.cnn.com/2023/08/05/business/single-family-zoning-laws/index.html#:~:text=And%20thus%2C%20zoning%20laws%20protected,in%20their%20neighborhoods%20was%20used and https://www.npr.org/2022/03/29/1089174630/housing-shortage-new-home-construction-supply-chain#:~:text=Chris%20Arnold-,There’s%20never%20been%20such%20a%20severe%20shortage,in%20the%20U.S.%20Here’s%20why&text=Chris%20Arnold/NPR-,Builder%20Emerson%20Claus%20and%20his%20foreman%20Rene%20Landeverde%20at%20the,in%20a%20suburb%20of%20Boston.&text=Emerson%20Claus%20has%20been%20building,housing%20bubble%20collapse%20in%20200.
23 See https://www.cfr.org/backgrounder/state-us-infrastructure?utm_source=perplexity.
24 See https://infrastructurereportcard.org/wp-content/uploads/2025/03/Full-Report-2025-Natl-IRC-WEB.pdf.
25 See https://www.transportation.gov/mission/budget/infrastructure-investment-and-jobs-act-iija-funding-status and https://www.fhwa.dot.gov/infrastructure-investment-and-jobs-act/funding.cfm#:~:text=The%20Infrastructure%20Investment%20and%20Jobs,fiscal%20years%202022%20through%202026).
26 See https://blogs.worldbank.org/en/ppps/effectiveness-infrastructure-investment-fiscal-stimulus-what-weve-learned.

